

A very lightweight lit-element component for drawing line charts. This component directly uses SVG tag to draw charts without any additional graphic libraries.
npm install -S nk-line-chart
<style>
  nk-line-chart {
    width: 340px;
    height: 120px;
    border: solid 1px #ccc;
  }
</style>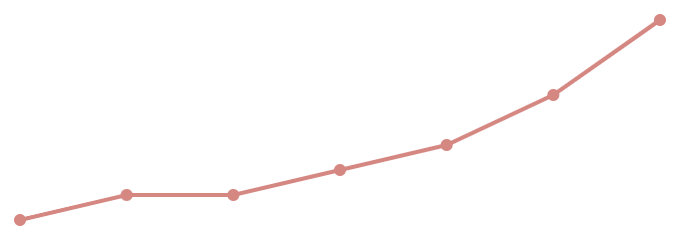
<nk-line-chart
  data="[[
    [0, 0], [1, 1], [2, 1], [3, 2], [4, 3], [5, 5], [6, 8]
  ]]"
  chartArea='{
    "top": 10,
    "left": 10,
    "width": 320,
    "height": 100
  }'>
</nk-line-chart>
<nk-line-chart
  data="[
    [[0, 0], [1, 1], [2, 1], [3, 2], [4, 3], [5, 5], [6, 8]],
    [[0, 8], [1, 7], [2, 6], [3, 5], [4, 4], [5, 3], [6, 2]]
  ]"
  chartArea='{
    "top": 10,
    "left": 10,
    "width": 320,
    "height": 100
  }'>
</nk-line-chart>
<nk-line-chart
  data="[[
    [0, 0], [1, 1], [2, 1], [3, 2], [4, 3], [5, 5], [6, 8]
  ]]"
  chartArea='{
    "top": 20,
    "left": 20,
    "width": 300,
    "height": 80
  }'
  pointLabel='{
    "enabled": true,
    "offset": {
      "y": -6
    },
    "text": {
      "attrs": {
        "fill": "#666",
        "text-anchor": "middle"
      }
    }
  }'>
</nk-line-chart>
<nk-line-chart
  data="[[
    [0, 0], [1, 1], [2, 1], [3, 2], [4, 3], [5, 5], [6, 8]
  ]]"
  chartArea='{
    "top": 10,
    "left": 10,
    "width": 320,
    "height": 100
  }'
  xRange='{
    "min": 0,
    "max": 10
  }'>
</nk-line-chart>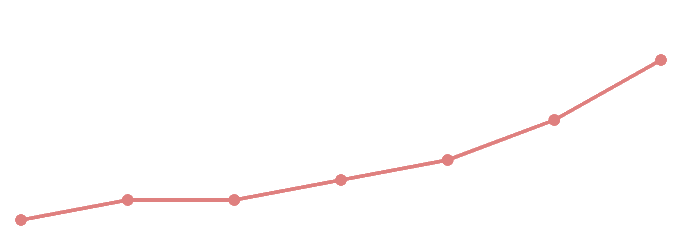
<nk-line-chart
  data="[[
    [0, 0], [1, 1], [2, 1], [3, 2], [4, 3], [5, 5], [6, 8]
  ]]"
  chartArea='{
    "top": 10,
    "left": 10,
    "width": 320,
    "height": 100
  }'
  yRange='{
    "min": 0,
    "max": 10
  }'>
</nk-line-chart>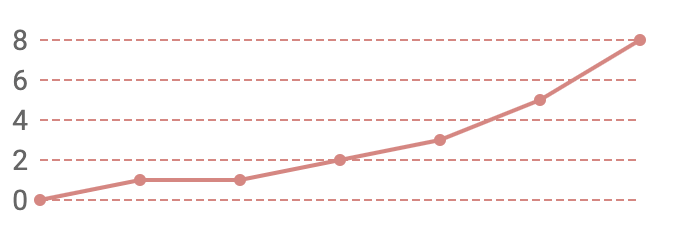
<nk-line-chart
  data="[[
    [0, 0], [1, 1], [2, 1], [3, 2], [4, 3], [5, 5], [6, 8]
  ]]"
  chartArea='{
    "top": 20,
    "left": 20,
    "width": 300,
    "height": 80
  }'
  xAxis='{
    "enabled": true,
    "label": {
      "enabled": true,
      "offset": {
        "x": -6,
        "y": 5
      },
      "text": {
        "attrs": {
          "font-size": "14px",
          "fill": "#666",
          "text-anchor": "end"
        }
      }
    },
    "line": {
      "attrs": {
        "fill": "none",
        "stroke": "#e08080",
        "stroke-dasharray": "4,2",
        "stroke-width": 1
      }
    },
    "tickInterval": 2
  }'>
</nk-line-chart>
<nk-line-chart
  data="[[
    [0, 0], [1, 1], [2, 1], [3, 2], [4, 3], [5, 5], [6, 8]
  ]]"
  chartArea='{
    "top": 20,
    "left": 20,
    "width": 300,
    "height": 80
  }'
  yAxis='{
    "enabled": true,
    "label": {
      "enabled": true,
      "offset": {
        "x": 0,
        "y": 15
      },
      "text": {
        "attrs": {
          "font-size": "14px",
          "fill": "#666",
          "text-anchor": "middle"
        }
      }
    },
    "line": {
      "attrs": {
        "fill": "none",
        "stroke": "#e08080",
        "stroke-dasharray": "4,2",
        "stroke-width": 1
      }
    },
    "tickInterval": 2
  }'>
</nk-line-chart>
<nk-line-chart
  data="[[
    [0, 0], [1, 1], [2, 1], [3, 2], [4, 3], [5, 5], [6, 8]
  ]]"
  chartArea='{
    "top": 10,
    "left": 10,
    "width": 320,
    "height": 100
  }'
  origin="left-bottom">
</nk-line-chart>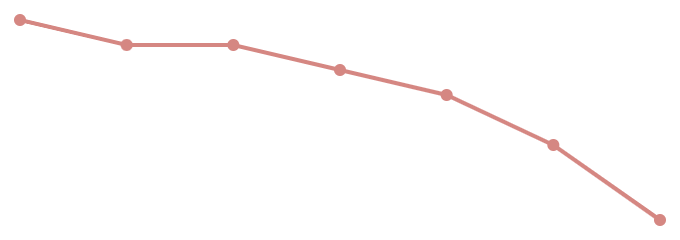
<nk-line-chart
  data="[[
    [0, 0], [1, 1], [2, 1], [3, 2], [4, 3], [5, 5], [6, 8]
  ]]"
  chartArea='{
    "top": 10,
    "left": 10,
    "width": 320,
    "height": 100
  }'
  origin="left-top">
</nk-line-chart>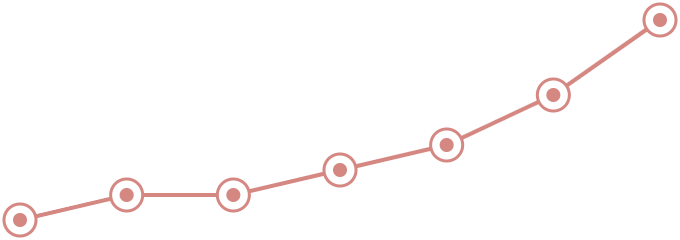
<nk-line-chart
  data="[[
    [0, 0], [1, 1], [2, 1], [3, 2], [4, 3], [5, 5], [6, 8]
  ]]"
  chartArea='{
    "top": 10,
    "left": 10,
    "width": 320,
    "height": 100
  }'
  series='[
    {
      "point": {
        "enabled": true,
        "elements": [
          {
            "name": "circle",
            "attrs": {
              "fill": "#fff",
              "r": "8",
              "stroke": "#e08080",
              "stroke-width": 1.5
            }
          },
          {
            "name": "circle",
            "attrs": {
              "fill": "#e08080",
              "r": "3.5",
              "stroke": "none",
              "stroke-width": 0
            }
          }
        ]
      },
      "line": {
        "attrs": {
          "stroke": "#e08080"
        }
      }
    }
  ]'>
</nk-line-chart>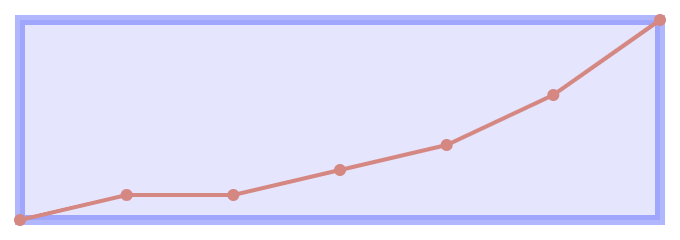
<nk-line-chart
  data="[[
    [0, 0], [1, 1], [2, 1], [3, 2], [4, 3], [5, 5], [6, 8]
  ]]"
  chartArea='{
    "top": 10,
    "left": 10,
    "width": 320,
    "height": 100
  }'
  backgroundRect='{
    "attrs": {
      "fill": "#00f",
      "fill-opacity": 0.1,
      "stroke": "#00f",
      "stroke-width": 5,
      "stroke-opacity": 0.3
    }
  }'>
</nk-line-chart>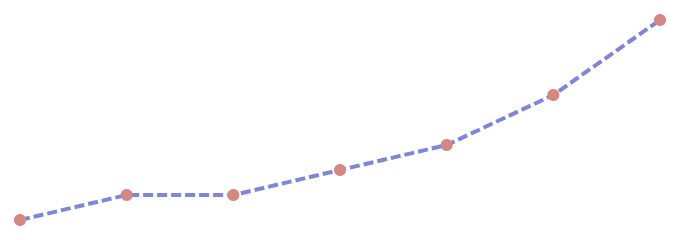
<nk-line-chart
  data="[[
    [0, 0], [1, 1], [2, 1], [3, 2], [4, 3], [5, 5], [6, 8]
  ]]"
  chartArea='{
    "top": 10,
    "left": 10,
    "width": 320,
    "height": 100
  }'
  series='[{
    "point": {
      "elements": [
        {
          "attrs": {
            "fill": "#e08080"
          }
        }
      ]
    },
    "line": {
      "attrs": {
        "stroke": "#8080e0",
        "stroke-width": 2,
        "stroke-dasharray": "5, 2",
        "fill-opacity": 1,
        "fill": "none"
      }
    }
  }]'>
</nk-line-chart>npm run demo
npm run test
For watch mode,
npm run test:watch
Testing in watch mode, you can view coverage files by
open http://localhost:8080/coverage/