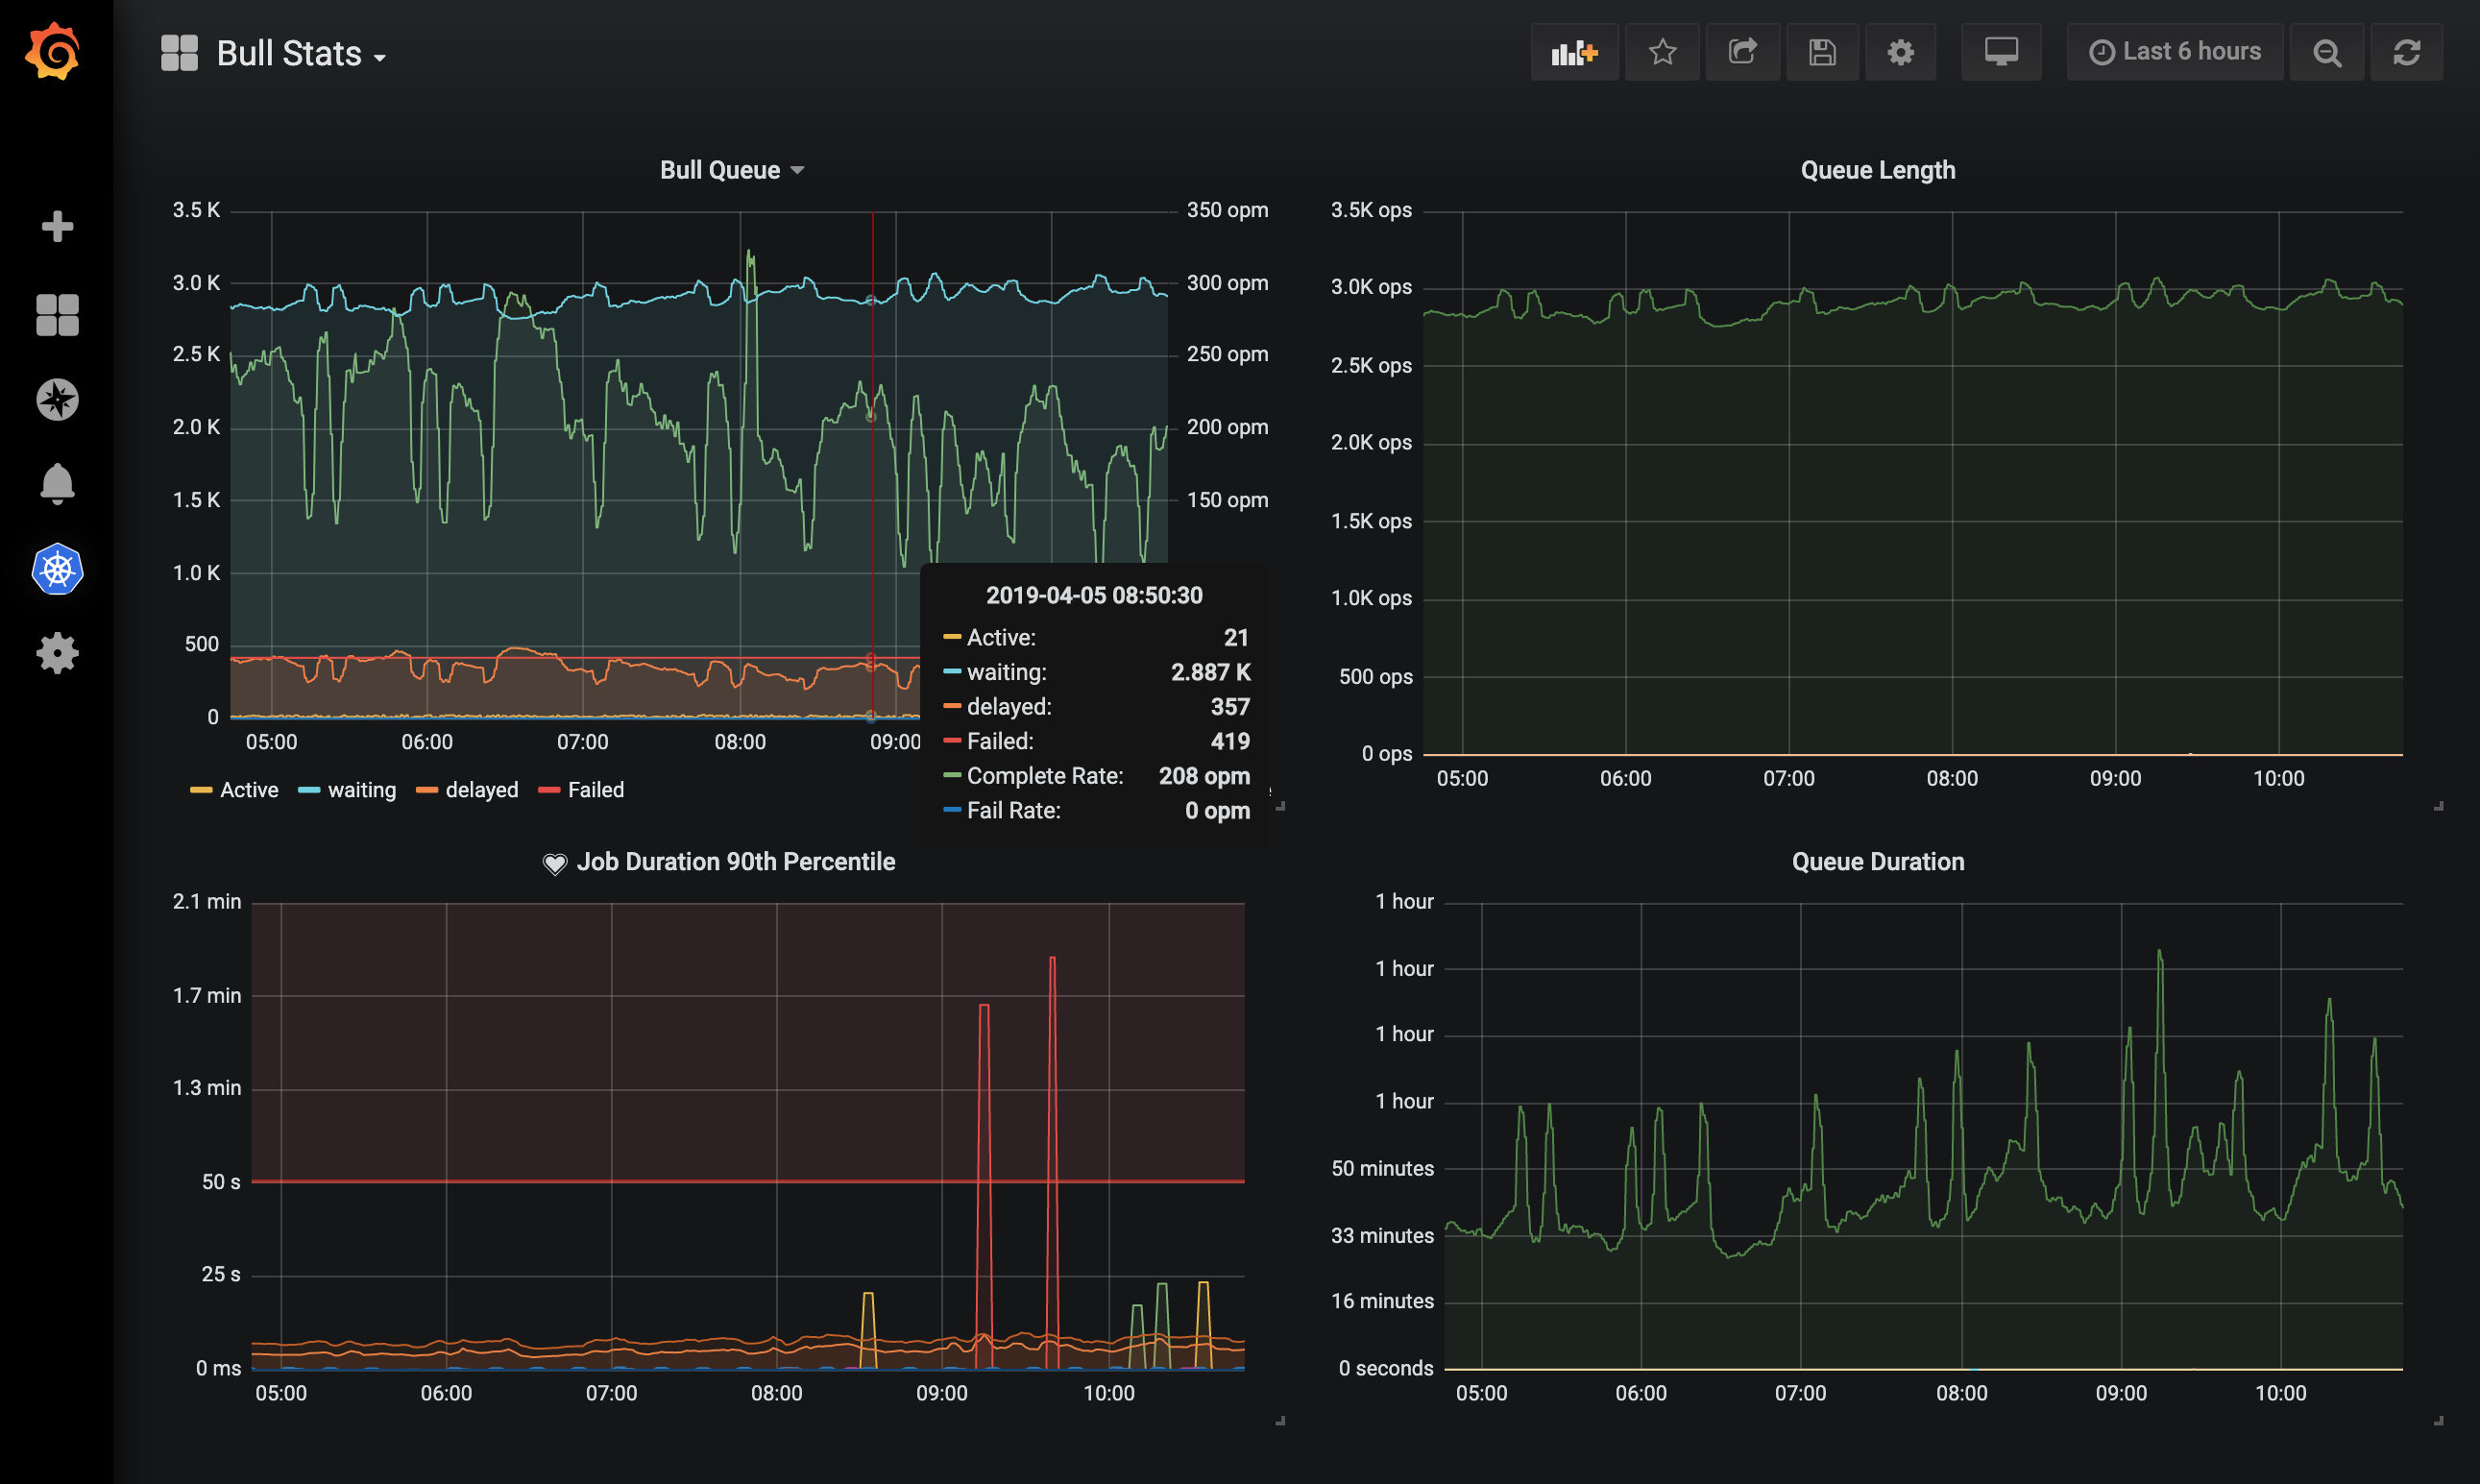
Prometheus exporter for Bull metrics.
An existing prometheus server is required to use this project
To learn more about how to setup promethues and grafana see: https://eksworkshop.com/monitoring/
The dashboard pictured above is available to download from grafana. It will work aslong as EXPORTER_STAT_PREFIX is not changed.
Queues are discovered at start up by running KEYS bull:*:id
this can also be triggered manually from the /discover_queues endpoint
curl -XPOST localhost:9538/discover_queues
| Metric | type | description |
|---|---|---|
| bull_queue_completed | counter | Total number of completed jobs |
| bull_queue_complete_duration | summary | Processing time for completed jobs |
| bull_queue_active | counter | Total number of active jobs (currently being processed) |
| bull_queue_delayed | counter | Total number of jobs that will run in the future |
| bull_queue_failed | counter | Total number of failed jobs |
| bull_queue_waiting | counter | Total number of jobs waiting to be processed |
| variable | default | description |
|---|---|---|
| EXPORTER_REDIS_URL | redis://localhost:6379/0 | Redis uri to connect |
| EXPORTER_PREFIX | bull | prefix for queues |
| EXPORTER_STAT_PREFIX | bull_queue_ | prefix for exported metrics |
| EXPORTER_QUEUES | - | a space separated list of queues to check |
| EXPORTER_AUTODISCOVER | - | set to '0' or 'false' to disable queue discovery |
see: k8s-sample.yaml for more options
apiVersion: apps/v1

kind: Deployment
metadata:
  name: bull-exporter
  labels:
    app: bull
    role: exporter

spec:
  selector:
    matchLabels:
      app: bull
      role: exporter
  replicas: 1
  template:
    metadata:
      labels:
        app: bull
        role: exporter
    spec:
      containers:
        - name: bull-exporter
          image: uphabit/bull_exporter:latest
          securityContext:
            runAsGroup: 65534 # nobody
            runAsUser: 65534 # nobody
            runAsNonRoot: true
            privileged: false
            allowPrivilegeEscalation: false
            readOnlyRootFilesystem: true
            capabilities:
              drop:
                - all
          resources:
            requests:
              cpu: 100m
              memory: 128M
            limits:
              cpu: 200m
              memory: 512M
          env:
              # space delimited list of queues
            - name: EXPORTER_QUEUES
              value: "mail job_one video audio"

              # find the redis service in the cluster
            - name: EXPORTER_REDIS_URL
              value: redis://redis:6379/0
---
apiVersion: v1
kind: Service
metadata:
  name: bull-exporter
  labels:
    app: bull
    role: exporter
  annotations:
    prometheus.io/scrape: 'true'
    prometheus.io/port: '9538'
spec:
  type: ClusterIP
  ports:
    - name: http
      port: 9538
      targetPort: 9538
  selector:
    app: bull
    role: exporter


