In this project, 5 different statistical method implemented via MapReduce technique using Docker containers and Java Hadoop Client.
The dataset is a meteorology dataset. It has over 500 ground stations measuring pressure, temperature, humidity, wind direction and speed, dew point and precipitation, recorded every 6 min. The data have been collected by different meteorology stations that placed different places in France. The size of the dataset is about 1.8 GB. It is sampled to 200 MB to make local development possible with limited computational environment. Dataset is a CSV file and the fields are obtained by splitting the lines by commas.
This algorithm intended to help the maximum precipitation in records for easy comparison between the current time. The mapper doesn’t hold a specific key so the algorithm reduces all the information to a one row.
This algorithm intended to show the highest range between minimum and maximum temperature. Like the Max Precipitation, the algorithm does not store any specific key to reducing to one row. The numbers are respectively, the min, the max, and total number of instances.
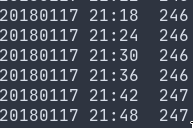
This algorithm helps to protect or check the data integrity. Because of the existence of a specified interval in the documentation, the calculations must be correct for those intervals. This algorithm calculates the number of measurements in each time stamp.
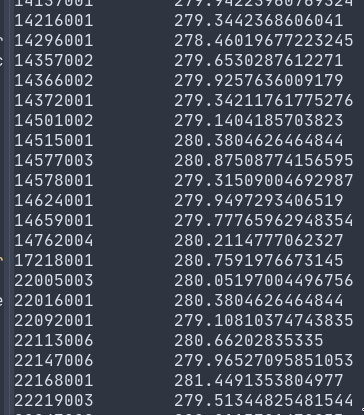
This algorithm calculates average temperatures for each measurement station. This calculation made by grouping the key of station numbers and reducing them to their averages. The temperature values are in Kelvin.
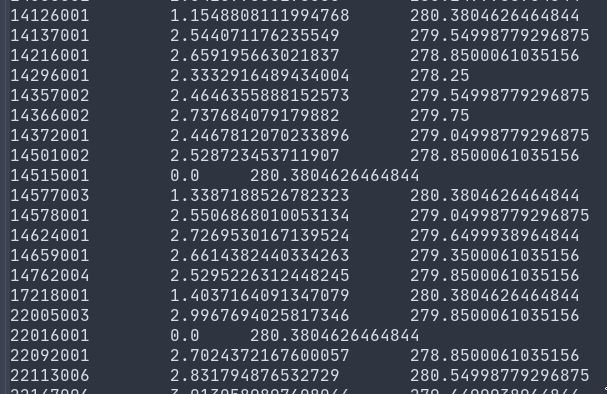
This algorithm helps to understand the climate by showing the variety of the temperatures in each measurement station. The numbers are the station number, standard deviation of the temperatures, mean of the temperatures respectively.
The project is implemented in two main parts. One is dockerized hadoop
environment. The other one is operational Java environment. All the components
is bundled using a Makefile. In order to launch the environment and the java
project the only thing to do is type make run in the project directory. If
there is no make utility available, the commands should be manually be typed in
a command line. There must be Docker, Docker Compose and maven installed in
the system.
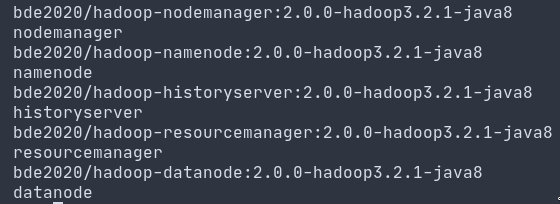
The development of the docker environment is simplified using Docker Compose and prebuilt Java containers. There are 5 containers needed to be launched to run a proper hadoop environment. The container, named namenode is the master of the structure. Datanode is a slave node for hadoop. Datanodes can be multiple and be launched via Docker Compose. The other nodes are the resource managers.
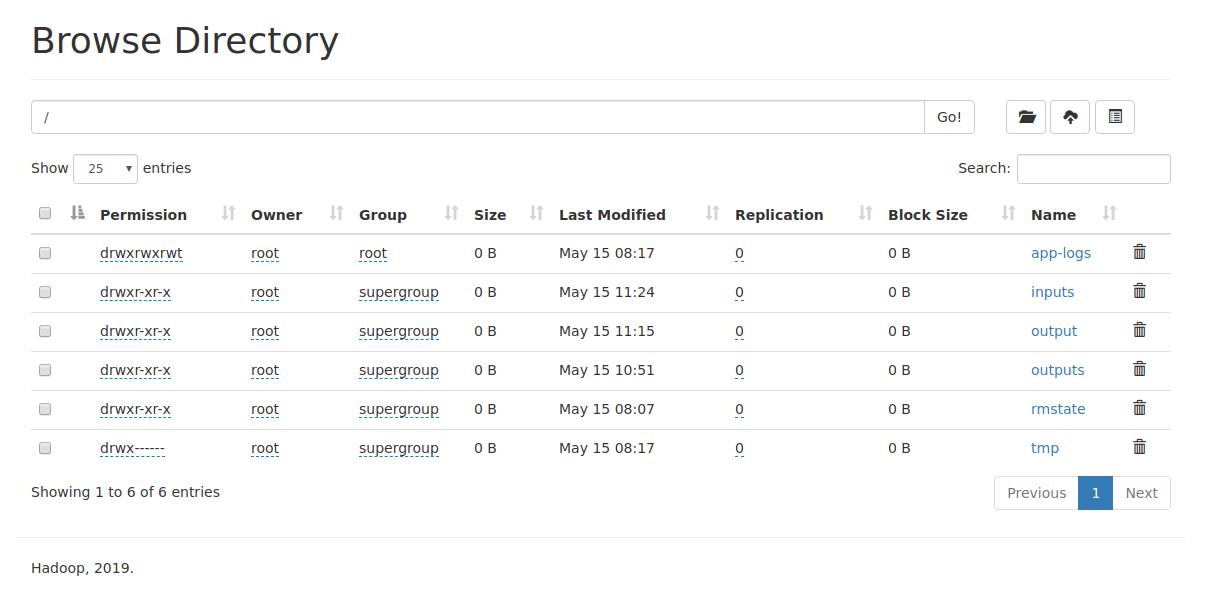
All the execution results can be monitored also using the native web service of
the Hadoop and Yarn. The default settings are http://localhost:9870 for the
Hadoop and http://localhost:8088 for the Yarn.
Files are uploaded using the native Java API of the Hadoop with the HDFS protocol. The experiment environment implemented in insecure mode. So there will be no need to require any authentication.
Execution of the jobs are handled via mapping a shared folder between local machine and docker namenode instance. The Java part of the project generates a command line script to run the jar of the job programmatically. In this process I could not handle the standard out stream. So even if the command runs successfully, there are no output like executing in the command line.
GUI part of the project implemented using Swing. The GUI has capable of uploading files to HDFS and runs the specified jobs. Because of the lacking of capability of displayin the output, the user have to be check the operation using the native web services of the libraries.
Result of Standard Deviation of the Temperatures of each Station job:
| Station ID | Standard Deviation | Mean |
|---|
When the number of nodes are low, performance of a HDFS system is slow in comparison between a single node system. In a simulated environment like in this project, the difference of the performance is more dramatic. In the examples, summing a one million numbers takes one minute. The replication system is more effective when there are many nodes as possible.


