Stock Screener, scans the NYSE & NASDAQ and displays a QT5 UI with Buys & Sells watchlists, as well as daily buy & sell signals.
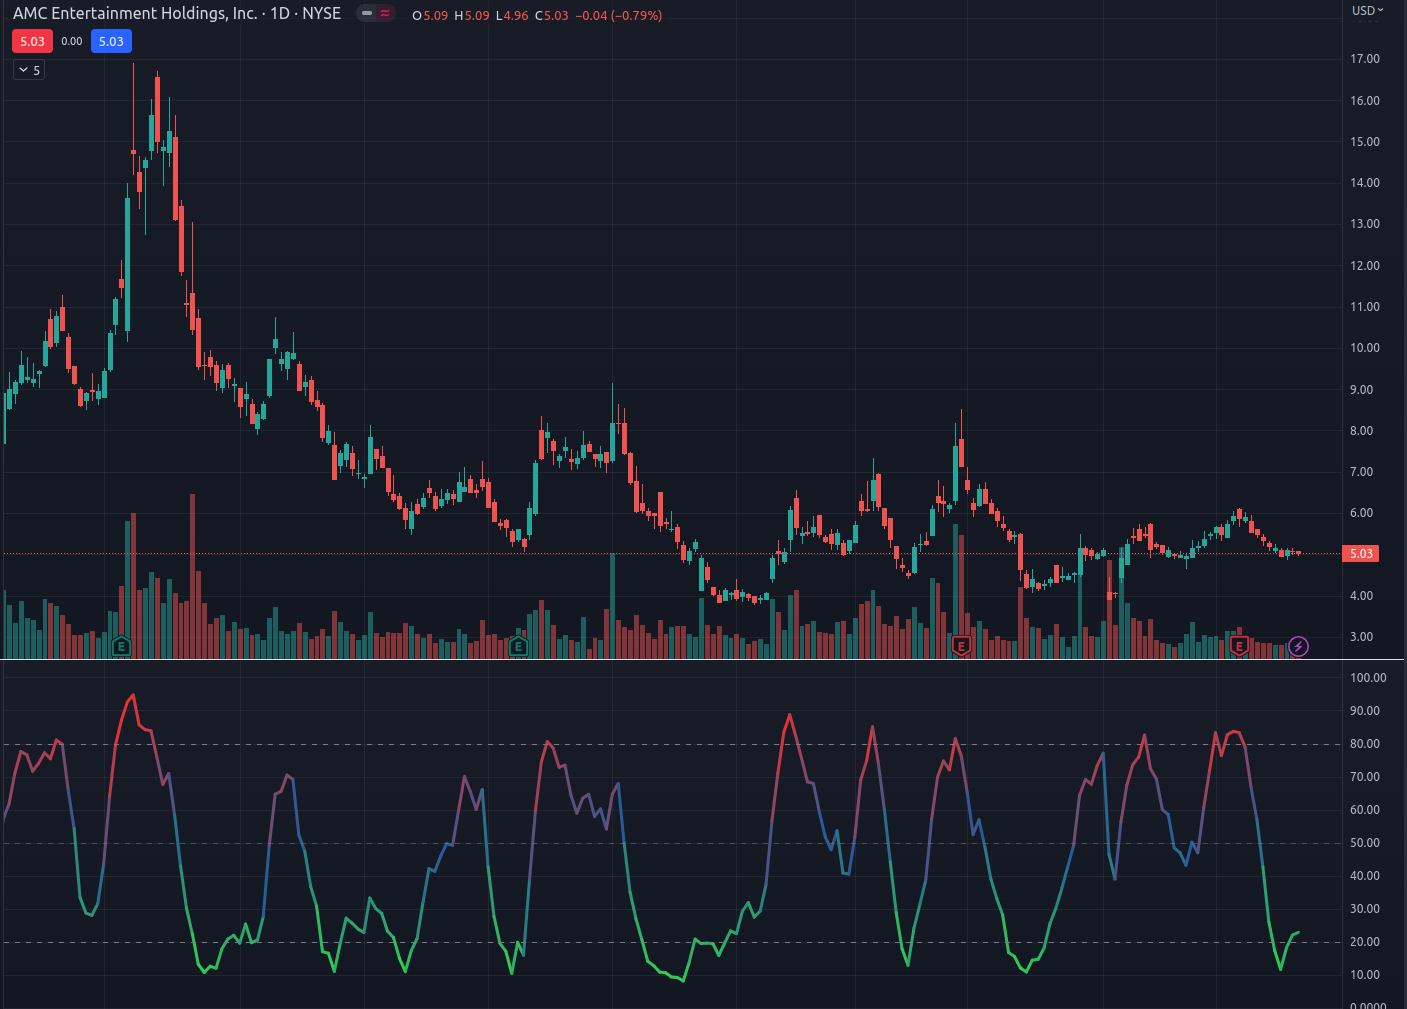
The Market Cycle indicator is a weighted average of the RSI, Stochastic RSI & Stochastic Oscillator.
I found it to be useful in finding the peaks and bottoms without much lag.
It returns a value in the range [0; 100]. Read it like the RSI indicator: < 20 is oversold, > 80 is overbought.
Tradingview indicator: https://www.tradingview.com/script/KutjMaH0-Market-Cycle-Indicator/
Export format: NYSE:AMC,NYSE:GME,NASDAQ:DKNG
Not an investment advice. Always do your own research, do not trade blindly off signals.
pip install -r requirements.txt
python main.py

