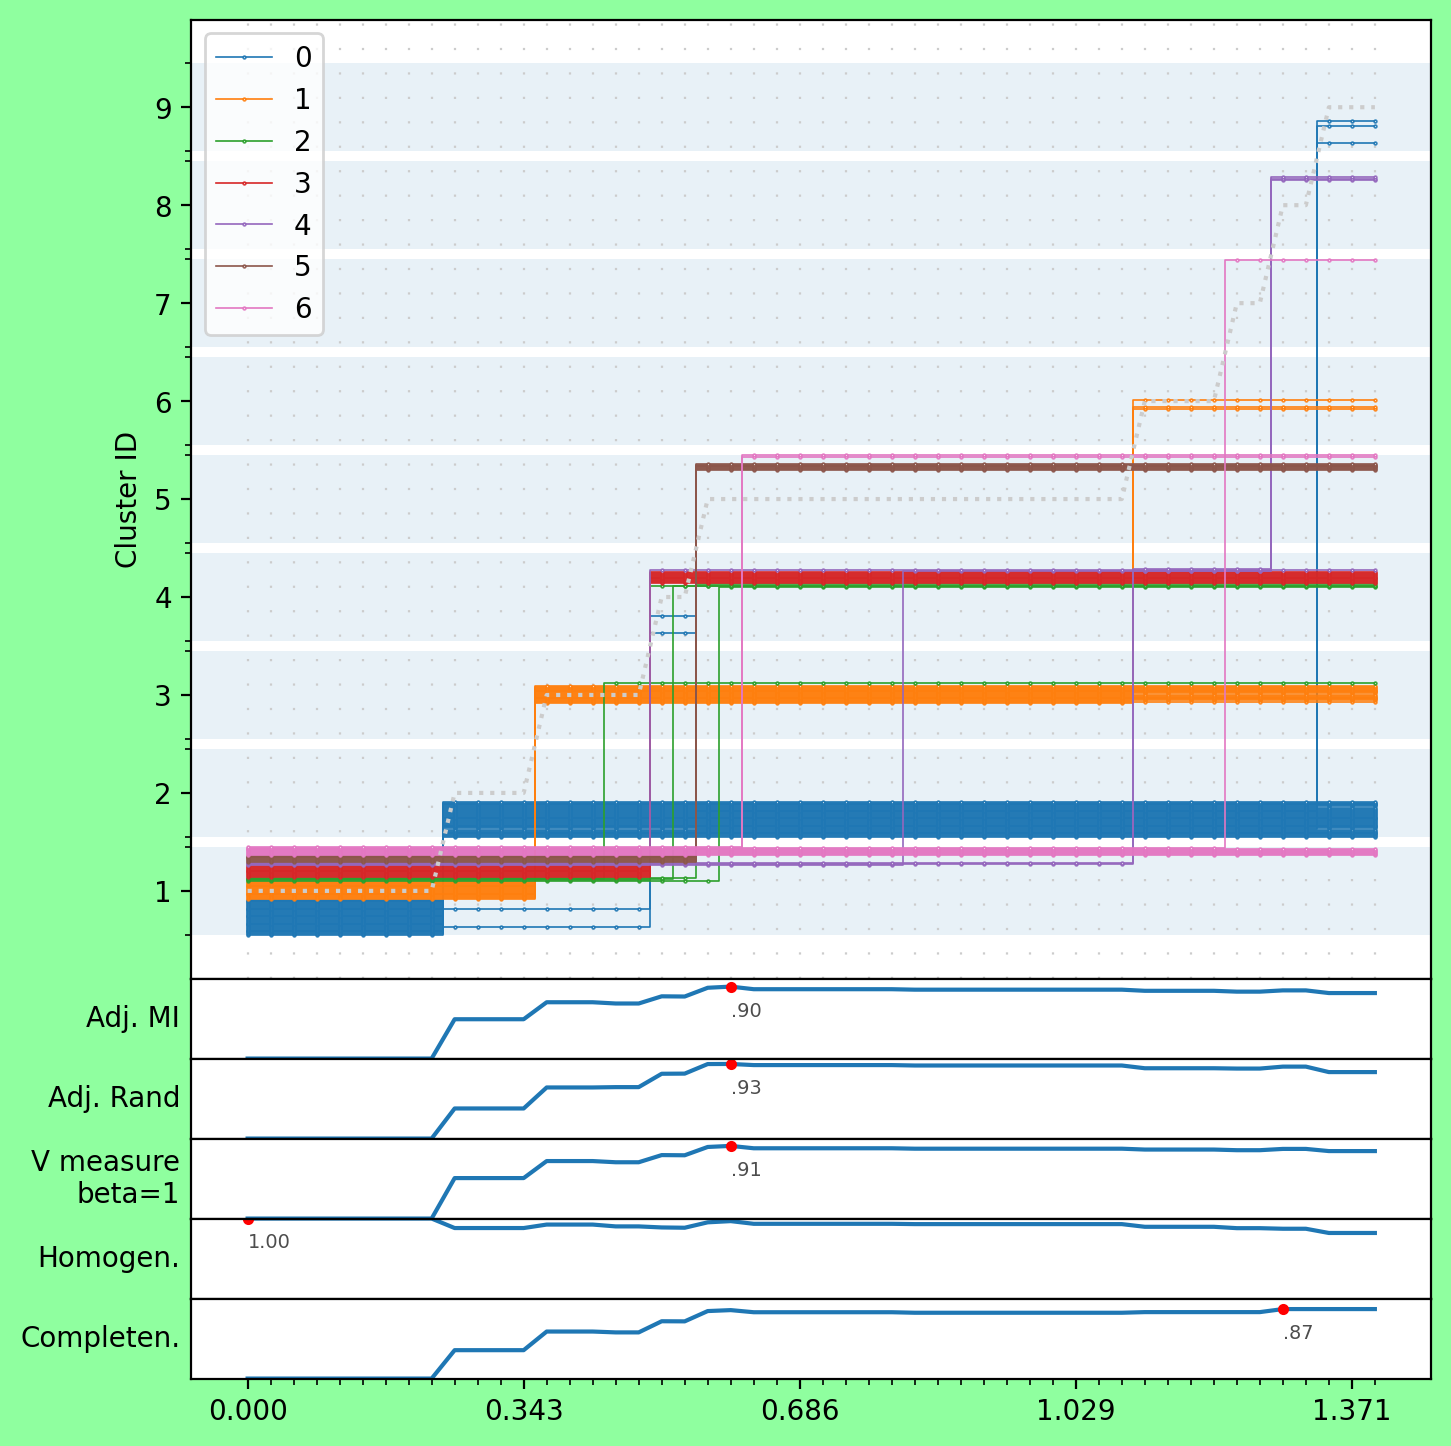
For visual inspection of how samples change clusters as a function of a parameter.
Unpack the clustergram folder into your working directory, or append to your sys.path.
In case you're missing some of the dependencies run:
$ pip install -r requirements.txt
from clustergram import Clustergram

Clustergram().draw(x, clusters, targets=y, scoring=True, linewidth=0.5)Clustergram exposes only one function, draw, for which short parameter reference follows below:
  x                 -  x values
  clusters          -  array of the shape (n_xvals, n_samples) of cluster IDs to which each sample belongs
  targets           -  if true labels are known, colors the plot accordingly
  sort              -  sort by targets (if supplied), hence aggregating and making true clusters easier to spot
  scoring           -  adds subplots with clustering scores using `sklearn.metrics`
  scoring_X         -  original feature array of the shape (n_samples, n_features) required for `sklearn.metrics.silhouette_score`
  optimize_labeling -  for best visual results, optimize cluster labeling as to minimize number of samples changing clusters between each step
For remaining parameters (mostly self-explanatory) see the source.
Clustergram with scoring plots, using data from the zoo dataset, and the BCPNN classifier (which uses the x values as the softmax probability distribution parameter G in the transfer function).
