Social and Information Network Analysis subject - Graph and Network Analytics
Is the proportion of links between the verticies within its neighbourhood divided by the number of links that could possibly exist between them.
if k is the number of verticies in the neighbourhood then number of links (edges) that could possibly exist is k(k-1)/2
--> C = number of links in neibhourhood / (k(k-1)/2)
nx.clustering(G)


nx.clustering(G)
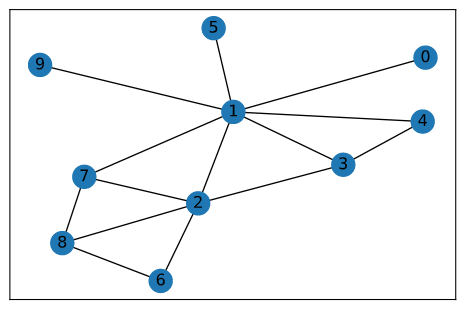
{1: 0.14285714285714285,
 2: 0.4,
 3: 0.6666666666666666,
 0: 0,
 4: 1.0,
 5: 0,
 6: 1.0,
 7: 0.6666666666666666,
 8: 0.6666666666666666,
 9: 0}
for node 1:
number of neighbours = 7
possible links in neighbourhood = 7 * 6 /2 = 21
links in neighbourhood = 3

=> clustering coeeff for node 1 = 3/21 = 0.14286
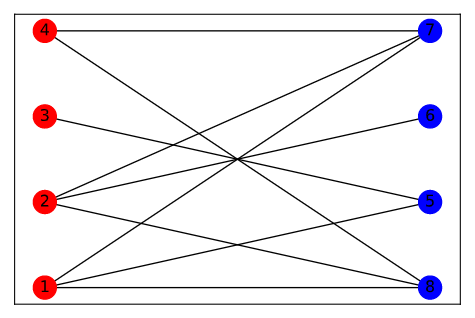
using the bipartite argument to denote bipartite sets 0 or 1 for nodes, then create edges from nodes in one set to the other
G = nx.Graph()
G.add_nodes_from([1,2,3,4], bipartite=0)
G.add_nodes_from([5,6,7,8], bipartite=1)

G.add_edges_from([(1,5),(1,7),(1,8)])
G.add_edges_from([(2,6),(2,7),(2,8)])
G.add_edges_from([(3,5)])
G.add_edges_from([(4,8),(4,7)])
the graph visualisation may not draw in the commonly know bipartite layout
so here we identify the two sets X and Y, then give them positions in two columns and assign colors.
calling the drawing function again with postion list and color list will produce a familiar bipartite network layout
we could potentilly have added attributes to the nodes when constructing the graph to indicate positions and colors or set memberships then used these additional attributes in drawing the graph, to be explored later (maybe!).
X, Y = bipartite.sets(G)

pos =dict([(n, (2, i)) for i, n in enumerate(Y)] + [(n, (1, i)) for i, n in enumerate(X)])

color_map = [ "red" if n in X else "blue" for n in G.nodes()]

nx.draw_networkx(G,pos=pos,node_color=color_map)
To test if graph is bipartite, we could use the function networkx.is_bipartite(). Returns True if set is bipartite.
nx.is_bipartite(G)

> TrueExamples in python:
- Concepts and Surprise package: (https://towardsdatascience.com/various-implementations-of-collaborative-filtering-100385c6dfe0)


