To write a program to implement the linear regression using gradient descent.
- Hardware – PCs
- Anaconda – Python 3.7 Installation / Moodle-Code Runner
- Import the standard libraries in python required for finding Gradient Design.
- Read the dataset file and check any null value using .isnull() method.
- Declare the default variables with respective values for linear regression.
- Calculate the loss using Mean Square Error.
- Predict the value of y.
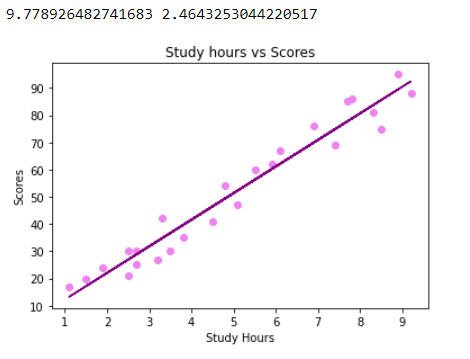
- Plot the graph respect to hours and scores using .scatterplot() method for Linear Regression.
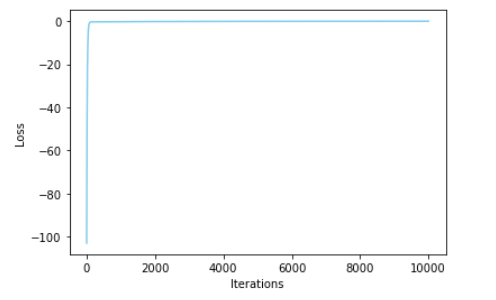
- Plot the graph respect to loss and iterations using .plot() method for Gradient Descent.
/*
Program to implement the linear regression using gradient descent.
Developed by: GAUTHAM M
RegisterNumber: 212221230027
*/
import pandas as pd
import numpy as np
import matplotlib.pyplot as plt
from sklearn.linear_model import LinearRegression
df=pd.read_csv('student_scores - student_scores.csv')
df.head()
df.tail()

#checking for null values in dataset
df.isnull().sum()

#To calculate Gradient decent and Linear Descent
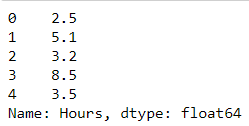
x=df.Hours
x.head()

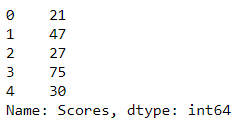
y=df.Scores
y.head()

n=len(x)
m=0
c=0
L=0.001
loss=[]
for i in range(10000):
    ypred = m*x + c
    MSE = (1/n) * sum((ypred - y)*2)
    dm = (2/n) * sum(x*(ypred-y))
    dc = (2/n) * sum(ypred-y)
    c = c-L*dc
    m = m-L*dm
    loss.append(MSE)
print(m,c)

#plotting Linear Regression graph
y_pred=m*x+c
plt.scatter(x,y,color="violet")
plt.plot(x,y_pred,color="purple")
plt.xlabel("Study Hours")
plt.ylabel("Scores")
plt.title("Study hours vs Scores")
plt.show()

#plotting Gradient Descent graph
plt.plot(loss, color="skyblue")
plt.xlabel("Iterations")
plt.ylabel("Loss")
plt.show()
Thus the program to implement the linear regression using gradient descent is written and verified using python programming.


