The city of Bengaluru, the administrative capital of the state of Karnataka in India, is a bustling metropolis with a population estimate of 8.4 million and an area of 741 km2. Despite housing less than a sixth of the state's population, Bengaluru contributes a significant 37% to Karnataka's GDP, boasting the highest per-capita income in the region (Economic Survey of Karnataka 2023-24, 2024). However, beneath the glamor of Bengaluru's tech hub reputation lies a stark reality: the existence of vast slum settlements.
Approximately 4.5 million people reside in Bengaluru's slums, a staggering number that has surged from 159 in 1971 to over 2000 in 2015. Initially constituting just over 10% of the population in 1971, slum residents now make up an estimated 25-35% of the city's populace (Roy et al., 2018). These informal settlements, often characterized by inadequate housing, lack of basic services, and precarious living conditions, present a significant challenge to the city's development and the well-being of its residents.
While research on slum communities has extensively focused on basic services like housing, water, sanitation, and electricity, the crucial role of transportation has often been overlooked. In densely populated slum areas with narrow streets, private car ownership is impractical due to both spatial constraints and residents' low incomes. Consequently, public transportation becomes a lifeline for slum residents, enabling them to access employment opportunities, healthcare facilities, educational institutions, and other essential services.
However, the inefficiencies of public transportation systems, such as delays, unreliability, and inadequate coverage, exacerbate the challenges faced by slum communities. This reliance on slow and inefficient transit systems hampers residents' ability to access employment, further perpetuating the cycle of poverty and marginalization. In Bengaluru, where congestion exacerbates transportation challenges, the city's transit system, while notable, might not adequately cater to the distinct needs of slum residents.
Through this report, I aim to highlight this critical dimension of urban mobility and social equity within Bengaluru's evolving transportation landscape. Specifically, I seek to explore the following research questions:
1. Measuring Transit Accessibility of Slums - Network Analysis: To assess the level of accessibility to public transportation for slum residents, I will conduct a network analysis to measure the walking distances to the nearest bus stops and metro stations. This analysis will provide insights into the average walking distances for all slums and identify the slums with the highest and lowest walking distances to transit facilities.
2. Measuring Correlation of Transit Accessibility and Housing Characteristics - Spatial Correlation: I will investigate the potential relationship between transit accessibility and the housing characteristics of slum communities. By employing spatial correlation techniques, I aim to determine whether the walking distances to transit facilities have any significant correlation with housing characteristics such as the predominant types of dwellings, construction materials, and other relevant factors.
3. Clustering of Slums based on Transit Accessibility and Housing Characteristics - K-Means Clustering: Building upon the previous analyses, I will utilize K-means clustering to group slums based on their transit accessibility and housing characteristics. This approach will enable the identification of distinct clusters or patterns, potentially revealing insights into the interplay between transportation access, housing conditions, and other socio-economic factors within slum communities.
To conduct these analyses, I will leverage the following data sources:
-
National Slum Federation (NSDF) 2022 data: This dataset provides comprehensive information on the slums in Bengaluru, including their locations, housing characteristics, and demographic profiles.
-
BMTC bus stop data: This dataset contains the locations of bus stops operated by the Bangalore Metropolitan Transport Corporation (BMTC), the primary public bus service provider in the city.
-
Metro station data from Opencity.in: These sources provide the locations of metro stations in Bengaluru, enabling the analysis of accessibility to the city's rapid transit system.
-
OSMNX: For the street network
For the first research question, I will conduct a network analysis to measure the walking distances to the closest bus stops and metro stations from each slum. This analysis will involve calculating the average walking distance across all slums and identifying the top five slums with the highest and lowest walking distances for both bus and metro transit modes.
To address the second research question, I will employ spatial correlation techniques, specifically the Pearson correlation coefficient, to measure the strength and direction of the relationship between transit accessibility (walking distances) and various housing characteristics of the slums.
Finally, for the third research question, I will utilize K-means clustering to group slums based on their transit accessibility and housing characteristics. This unsupervised machine learning technique will help identify distinct clusters or patterns within the data, potentially revealing insights into the interplay between transportation access, housing conditions, and other socio-economic factors affecting slum communities.
Through this comprehensive analysis, I aim to provide a holistic understanding of the transportation challenges faced by slum residents in Bengaluru and the potential implications for urban planning and policy decisions. By shedding light on these issues, this report seeks to contribute to ongoing efforts towards creating more inclusive, equitable, and sustainable urban environments.
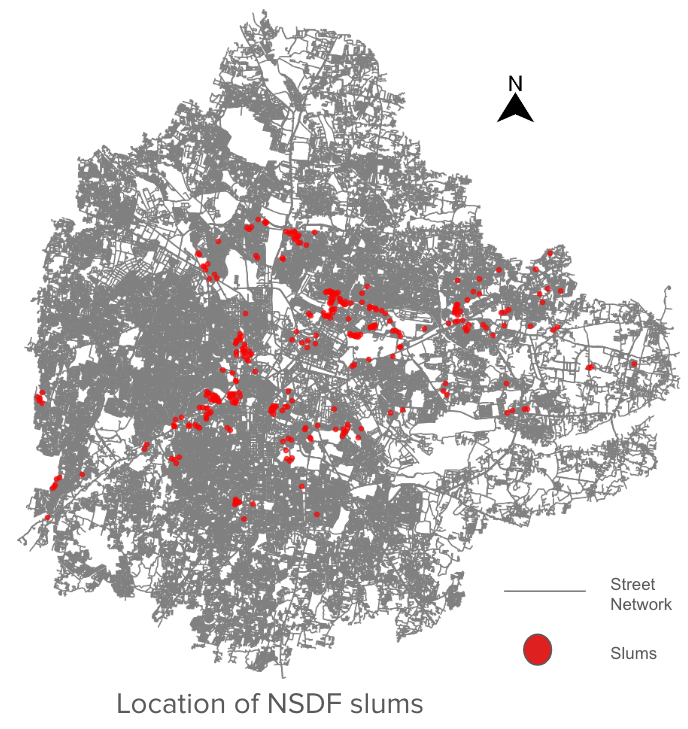
Fig 1: Location of 312 Slums (Source: NSDF 2015)
Before delving into the results of our analysis, it is crucial to understand the context of public transportation and housing characteristics in Bengaluru, which will aid in deciphering and interpreting the findings.
The mainstay of public transportation in Bengaluru is the bus service operated by the Bangalore Metropolitan Transport Corporation (BMTC). With a fleet of 6,073 city buses, BMTC caters to more than 3.5 million passengers per day across the entire metropolitan region, including four other towns in addition to Bengaluru city. BMTC is a state-run parastatal organization, and the city corporation has limited involvement in its operations.
However, the fleet size has remained stagnant for the past decade, rendering it inadequate to meet the growing demand for public transportation in the rapidly expanding city. In response, the Slum Dwellers Federation has advocated for increasing the fleet size to 10,000 buses by 2025. Furthermore, the Comprehensive Mobility Plan for the Bengaluru Metropolitan Region, prepared by the state government, suggests a target of 16,000 buses by 2031 to address the transportation needs of the region effectively.
Complementing the bus service is the Bengaluru Metro, the city's secondary transit option, which has garnered substantial focus and investment from both the union and state governments. The metro currently spans two operational lines covering a total distance of 73.75 kilometers, with a daily ridership of approximately 0.7 million passengers. The Bangalore Metro Rail Corporation Limited (BMRCL) is responsible for the construction and operation of the Namma Metro, Bengaluru's rapid transit system. It is jointly owned by the Government of India and the state government.
Partially operational since 2011 and fully operational since 2014, the metro has received an investment of approximately $1.9 billion USD, including loans from international financial institutions such as the Japan International Cooperation Agency (JICA) and the Asian Development Bank (ADB). Phase 2 of the metro expansion is expected to receive an investment of approximately $4.5 billion USD, further extending the network and enhancing connectivity across the city.
Housing characteristics in slum communities vary widely, reflecting the diverse socio-economic conditions and levels of informality present in these settlements. Some key aspects to consider include:
-
Permanent Materials: Certain slum dwellings are constructed with permanent materials like bricks or concrete, offering greater durability and resistance to weather and natural disasters.
-
Temporary Materials: Other slum dwellings are made of temporary materials such as mud, thatch, or wood, making them less durable and more prone to damage from adverse weather conditions.
-
Semi-Permanent: Some slum dwellings feature walls constructed with permanent materials like bricks, while roofs are made of semi-permanent materials, providing a balance between durability and affordability.
-
Permanent Dwellings: Permanent structures typically have a longer lifespan and require minimal maintenance, offering greater stability and security for residents.
-
Temporary Dwellings: Temporary dwellings, on the other hand, have a shorter lifespan and may require frequent repairs, making them more vulnerable to environmental and weather-related challenges.
-
Semi-Permanent Dwellings: Dwellings with a mix of permanent and semi-permanent materials have a medium lifespan and require moderate maintenance, striking a balance between durability and affordability.
In the following sections, I explore the accessibility of both bus and metro services for slum residents, taking into account the varying housing characteristics and the potential implications for transportation access and mobility within these communities.

Fig 2: Pucca house
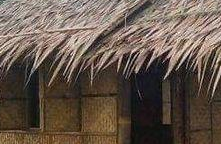
Fig 3: Kuccha House
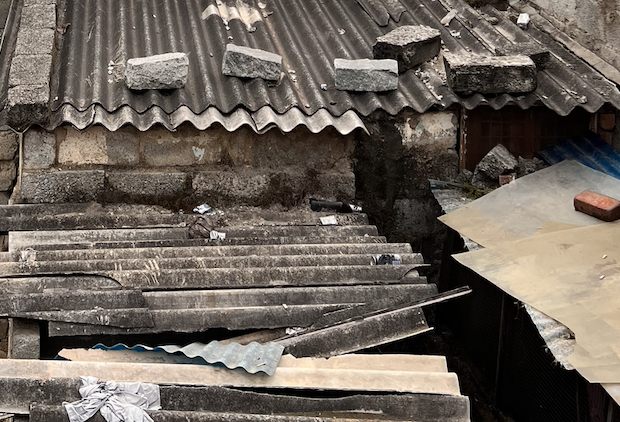
Fig 4: Semi Pucca House
To assess the accessibility of public transportation for slum residents in Bengaluru, a network analysis was conducted using the NetworkX and OSMnx libraries in Python. The analysis focused on two key components: (1) measuring the walking distance from each slum to the nearest bus stop, and (2) measuring the walking distance from each slum to the nearest metro station.
For the 312 slums identified in the National Slum Federation (NSDF) dataset and 1,799 bus stops across Bengaluru, the analysis revealed that the average walking distance from a slum to the nearest bus stop is approximately 0.25 miles (0.4 kilometers). However, it is important to note that there are significant variations among individual slums, with some experiencing considerably longer walking distances.
The table below highlights the slums with the highest walking distances to the nearest bus stop:
| Slum Name | Bus Stop Distance (m) | Number of Households | % Pucca houses | % Semi Pucca houses | % Kaccha Houses |
|---|---|---|---|---|---|
| Doddanekkundi | 0.75 | 5000 | 20 | 79 | 0.5 |
| R P Road | 0.69 | 90 | 44 | 44 | 11 |
| Annaih Reddy | 0.61 | 250 | 6 | 82 | 12 |
| Jyothipura | 0.61 | 360 | 6 | 6 | 11 |
In contrast, some slums, such as Netaji Subhash Chandra Bose and Nagasetta Halli, have bus stops located in their immediate vicinity, right on the street.
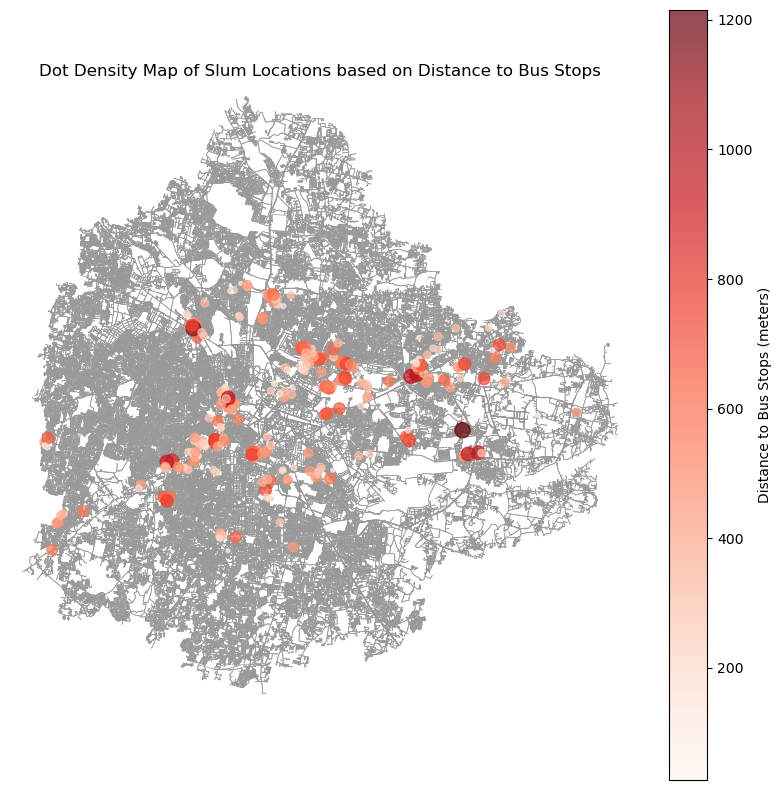
The analysis also explored the walking distances from the 312 slums to the 63 metro stations in Bengaluru. The results revealed that the average walking distance from a slum to the nearest metro station is significantly higher at approximately 2.9 miles (4.7 kilometers). This finding highlights the potential accessibility challenges faced by slum residents in accessing the city's rapid transit system.
The table below highlights the slums with the highest walking distances to the nearest metro station:
| Slum Name | Bus Stop Distance (m) | Number of Households | % Pucca houses | % Semi Pucca houses | % Kaccha Houses |
|---|---|---|---|---|---|
| Mallikarjuna | 6.7 | 1000 | 3 | 80 | 17 |
| Ulla Muslim Colony | 6.6 | 2000 | 7.5 | 89 | 3 |
| Ulla Sub Nagara | 6.5 | 300.0 | 6 | 76 | 16 |
| Ulla Uppu | 6.5 | 1500 | 3 | 86 | 10 |
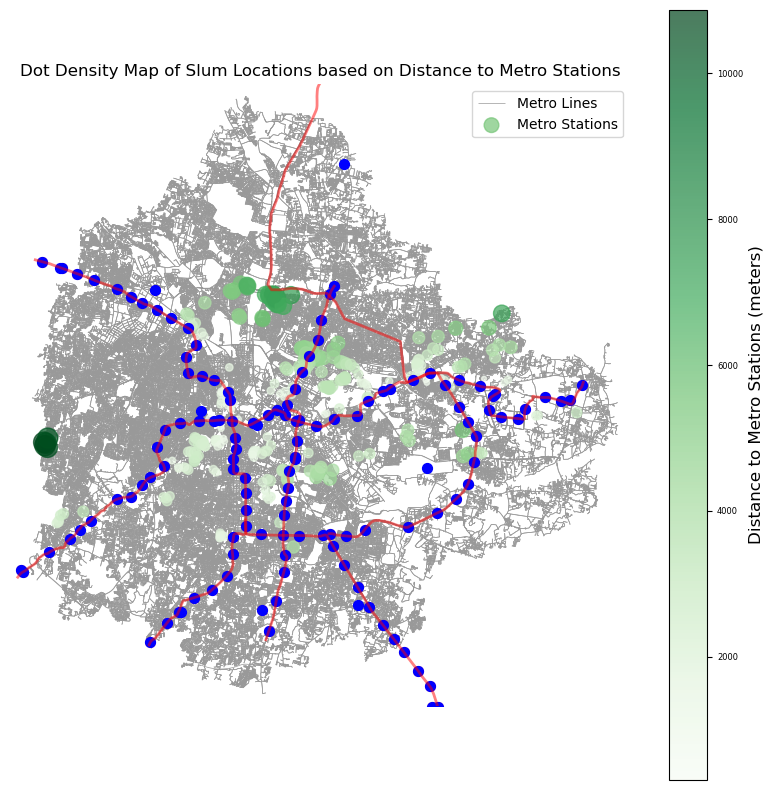
These findings underscore the potential accessibility challenges faced by slum residents in accessing the city's rapid transit system, potentially hindering their mobility and access to economic opportunities.
In the next section, we will explore the relationship between transit accessibility and housing characteristics within slum communities, shedding light on the interplay between transportation access and living conditions.
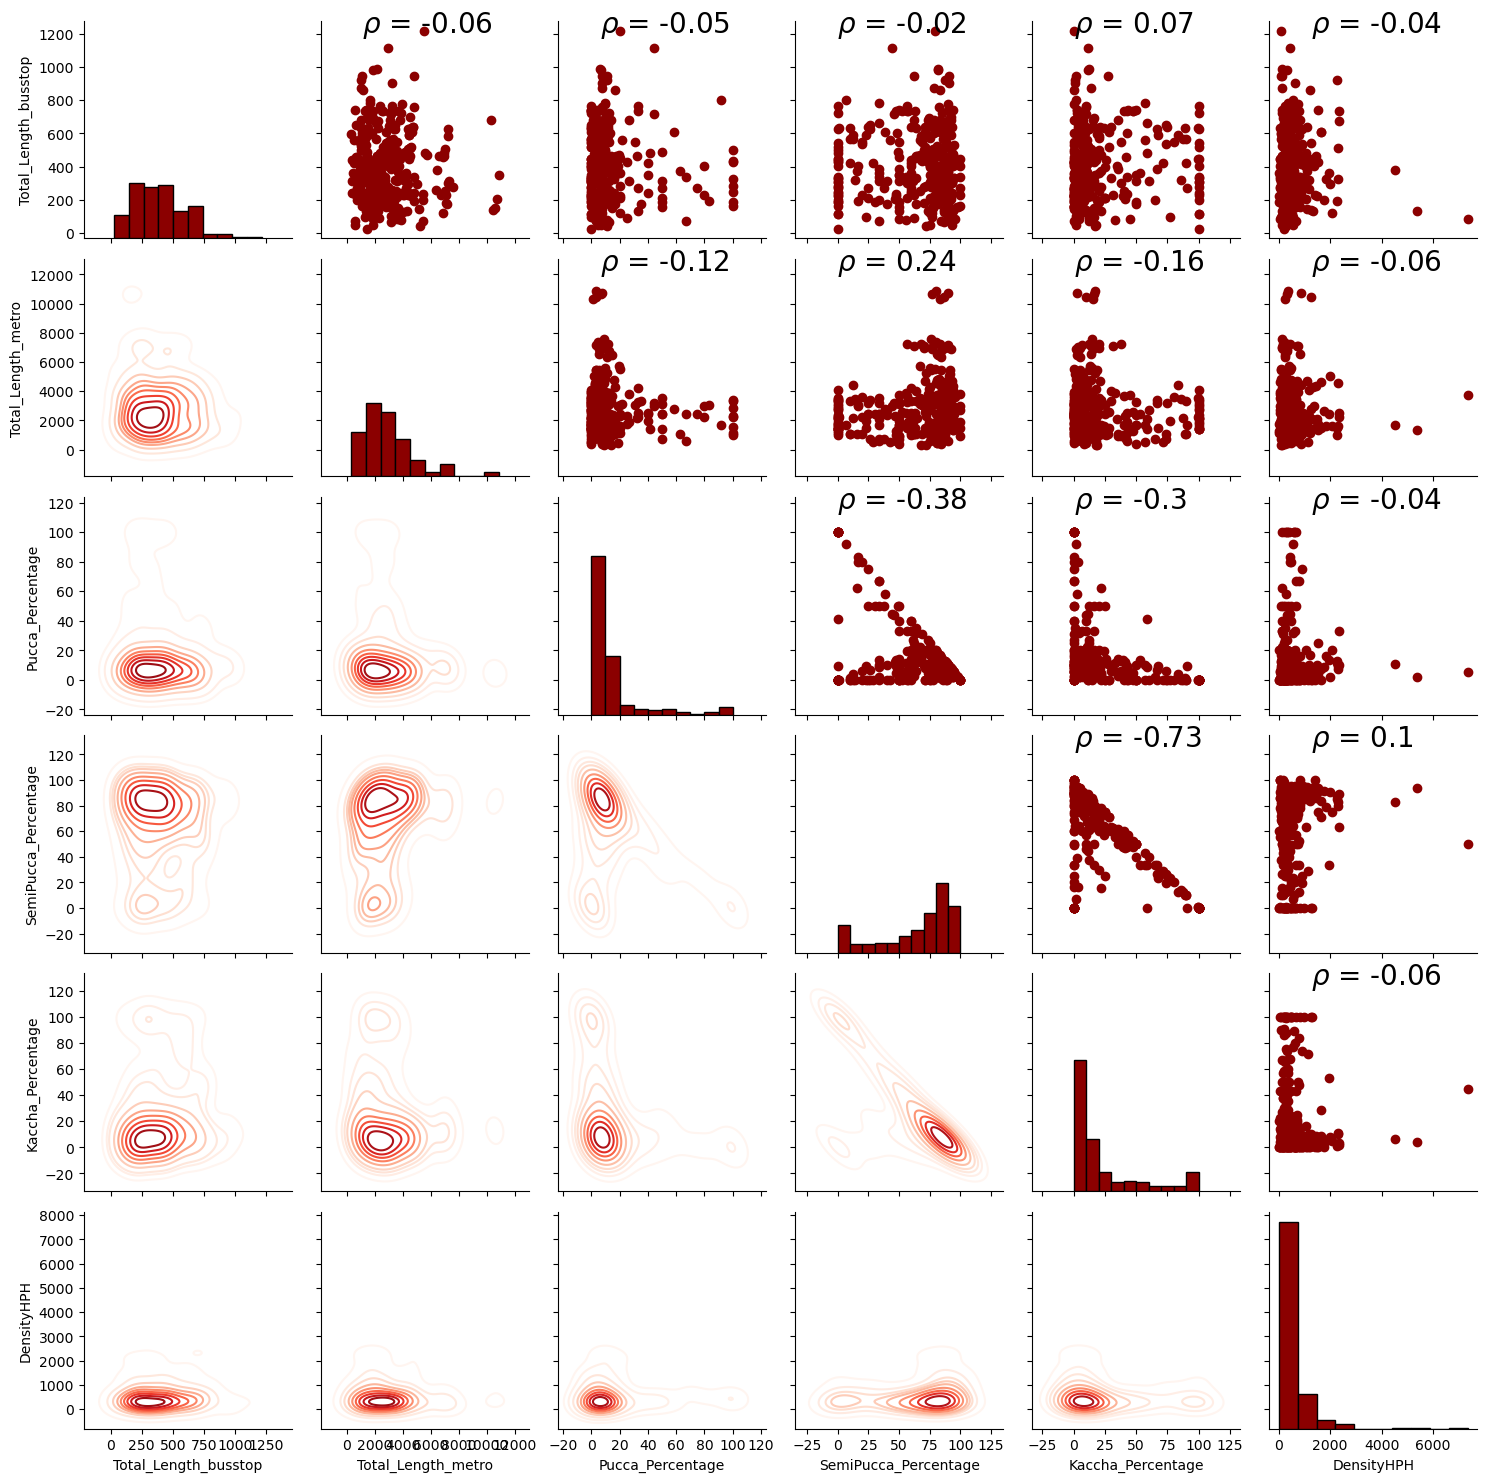
In my investigation, I utilize PairGrid plots to delve into the relationship between transit accessibility and various house characteristics. The upper triangle of the plot showcases scatter plots, offering insights into potential correlations. Conversely, the lower triangle presents kernel density estimation (KDE) plots, unveiling the distribution patterns within the dataset. Meanwhile, the diagonal displays histograms for specific variables extracted from the slum_locations dataframe.
Moreover, I go beyond mere visualization by employing statistical techniques to compute and annotate the correlation coefficient (ρ) for each pair of variables depicted in the PairGrid. This quantitative assessment adds depth to my understanding, providing a comprehensive view of the interplay between transit accessibility and house characteristics.
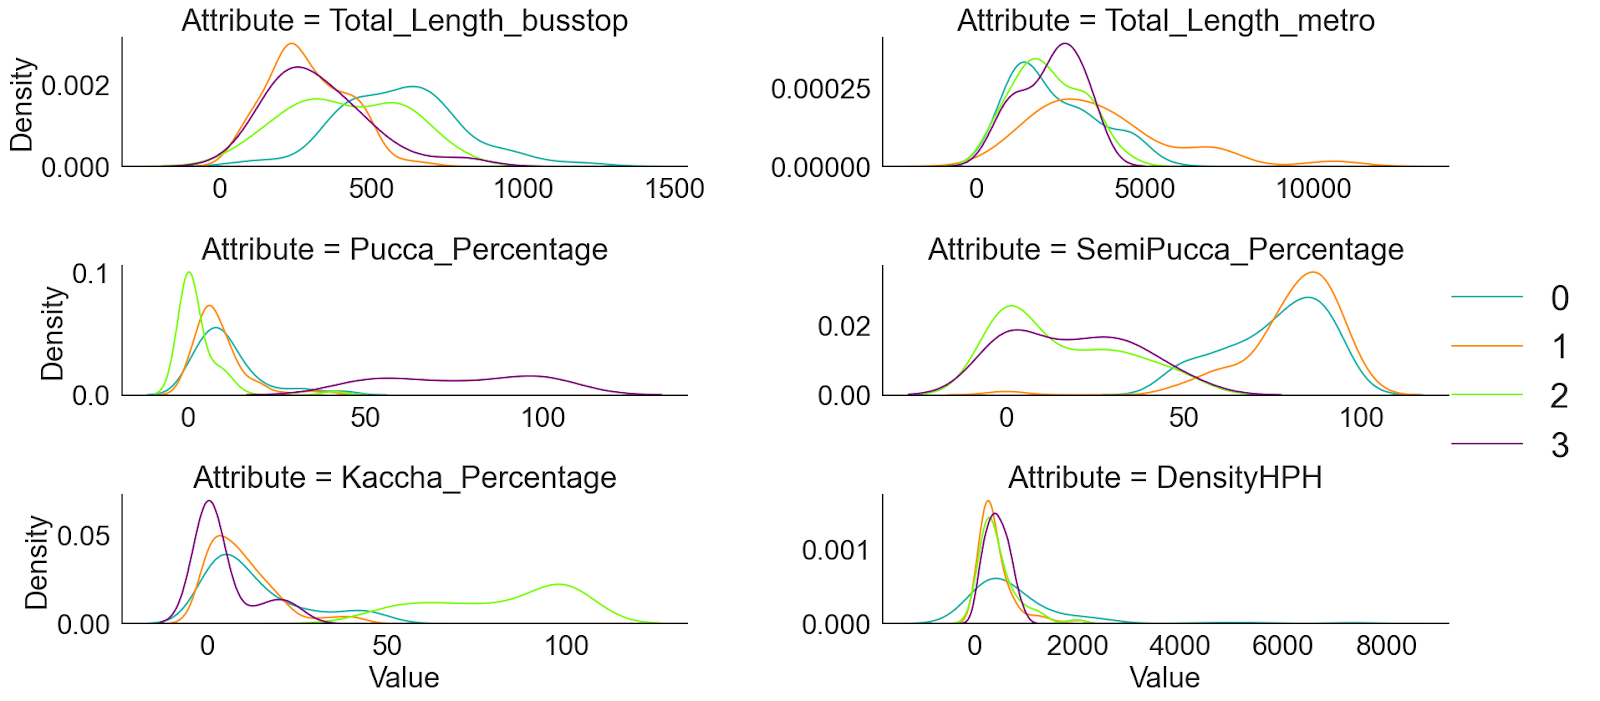
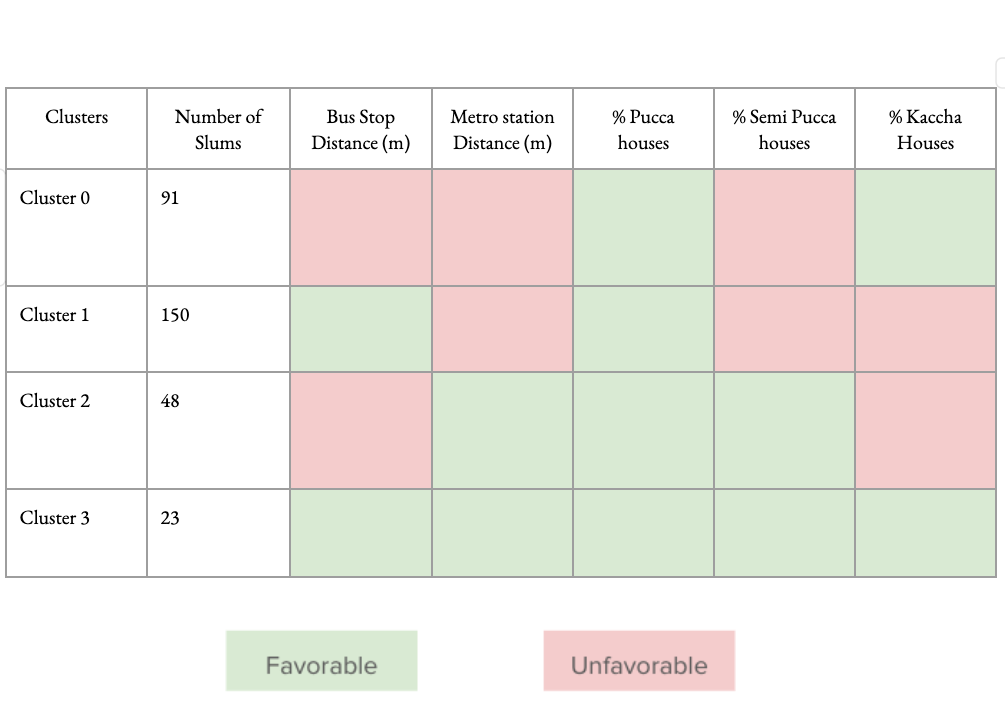
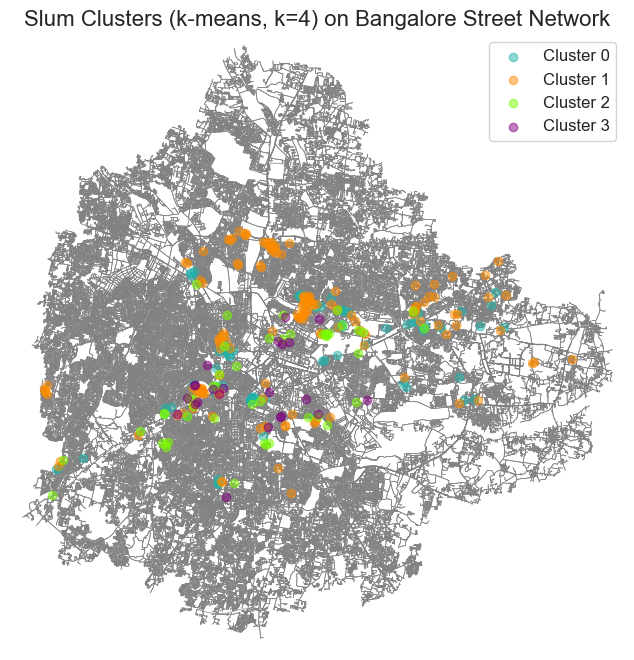
Clustering analysis involving five variables, employing the K-means algorithm to create four distinct clusters. Below, is a summary of the statistical characteristics for each cluster:
| Cluster Variables | 0 | 1 | 2 | 3 |
|---|---|---|---|---|
| Bus Stop Distance (m) | 595.88 | 288.78 | 417.77 | 325.16 |
| Metro Distance (m) | 2300.70 | 3717.25 | 2133.77 | 2211.33 |
| % of Pucca Houses | 10.95 | 8.67 | 2.71 | 76.71 |
| % of Semi Pucca Houses | 75.76 | 80.45 | 15.63 | 18.75 |
| % of Kaccha Houses | 13.29 | 9.54 | 81.66 | 4.55 |
Additionally, for visual reference, the clusters are depicted in the image below. This analysis provides insights into the characteristics and distributions of the variables across the identified clusters, facilitating a deeper understanding of the underlying patterns within the data
Based on the above, I have tried to simply and summarize below.
Clusters have some spatial clustering as well (as shown below):
-
Proximity to bus stops is generally favorable for residents of informal settlements (slums), ensuring relatively good access to public transportation services.
-
An impressive 94% of informal settlements have bus stops located within a reasonable walking distance of 0.5 miles (0.8 kilometers), facilitating convenient access to the city's bus network.
-
In contrast, metro stations are significantly distant from most informal settlement locations, presenting a major challenge in terms of accessibility to the rapid transit system.
-
On average, residents of these settlements have to walk approximately 1.8 miles (2.9 kilometers) to reach the nearest metro station, which can be a considerable distance for daily commuting.
-
The situation is even more dire in the two most densely populated informal settlements, where the average walking distance to the closest metro station is a staggering 6.7 miles (10.8 kilometers), essentially rendering the metro system inaccessible for a significant portion of the population.
-
An analysis using K-means clustering techniques has revealed distinct spatial patterns among the locations of informal settlements.
-
These spatial clusters suggest potential relationships with the availability of amenities, housing characteristics, and transit accessibility within these settlements.
-
Cluster 1, which encompasses the highest number of informal settlements, is characterized by the highest percentage of temporary and semi-temporary housing structures and is also located the farthest from any metro station, exacerbating the challenges faced by residents in terms of access to rapid transit.
Economic Survey of Karnataka 2023-24. (2024). Planning, Programme Monitoring and Statistics Department. chrome-extension://efaidnbmnnnibpcajpcglclefindmkaj/https://des.karnataka.gov.in/storage/pdf-files/ARC/Economic_Survey_2023-24_FINALENGLISH.pdf\ Roy, D., Palavalli, B., Menon, N., King, R., Pfeffer, K., Lees, M., & Sloot, P. M. A. (2018). Survey-based socio-economic data from slums in Bangalore, India. Scientific Data, 5(1), 170200. https://doi.org/10.1038/sdata.2017.200