
In this assignment, you will build an interactive dashboard to explore the Belly Button Biodiversity DataSet.
Use Plotly.js to build interactive charts for your dashboard.
-
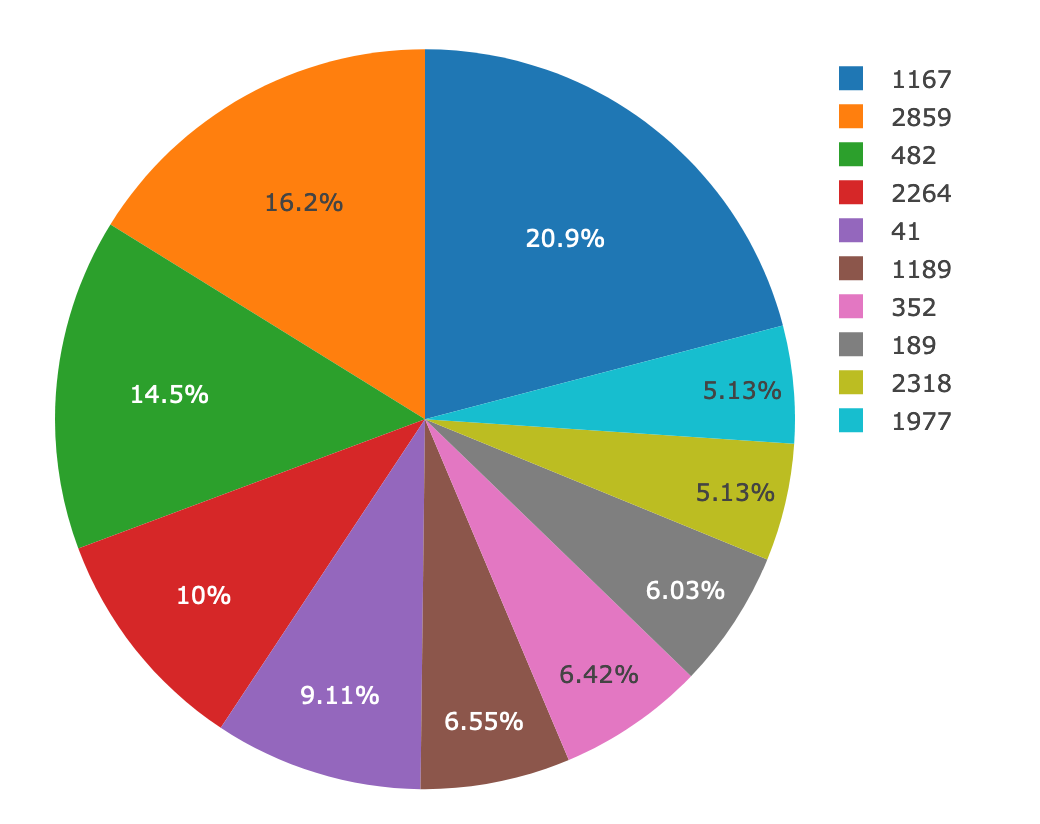
Create a PIE chart that uses data from your samples route (
/samples/<sample>) to display the top 10 samples.-
Use
sample_valuesas the values for the PIE chart. -
Use
otu_idsas the labels for the pie chart. -
Use
otu_labelsas the hovertext for the chart.
-
-
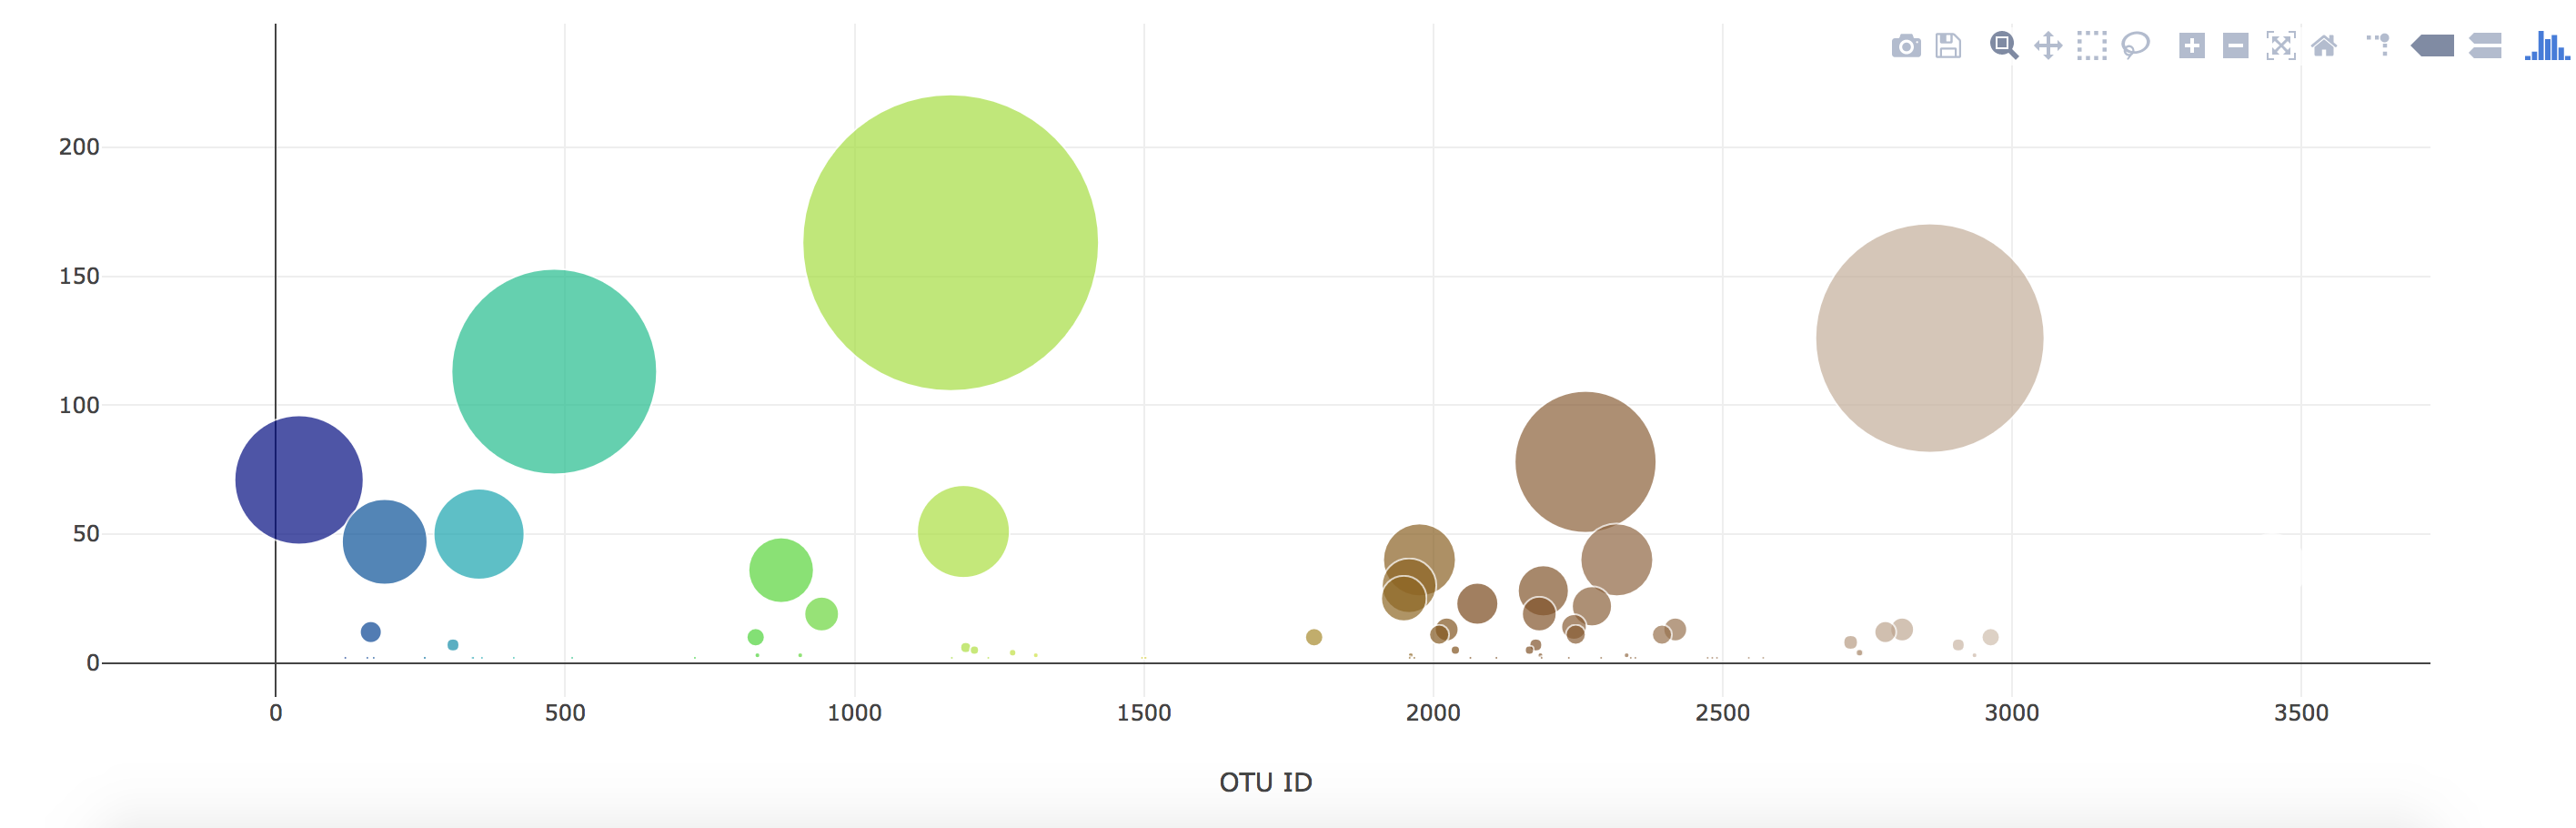
Create a Bubble Chart that uses data from your samples route (
/samples/<sample>) to display each sample.-
Use
otu_idsfor the x values. -
Use
sample_valuesfor the y values. -
Use
sample_valuesfor the marker size. -
Use
sample_valuesfor the marker colors. -
Use
otu_labelsfor the text values.
-
-
Display the sample metadata from the route
/metadata/<sample>- Display each key/value pair from the metadata JSON object somewhere on the page.
-
Update all of the plots any time that a new sample is selected.


Deployed my Flask app to Heroku.
- used the provided sqlite file for the database.
- Adapt the Gauge Chart from https://plot.ly/javascript/gauge-charts/ to plot the Weekly Washing Frequency obtained from the
/metadata/<sample>route.

Used Flask API starter code to serve the data needed for your plots.
- Tested my routes by visiting each one in the browser.
None to state