- NviWatch
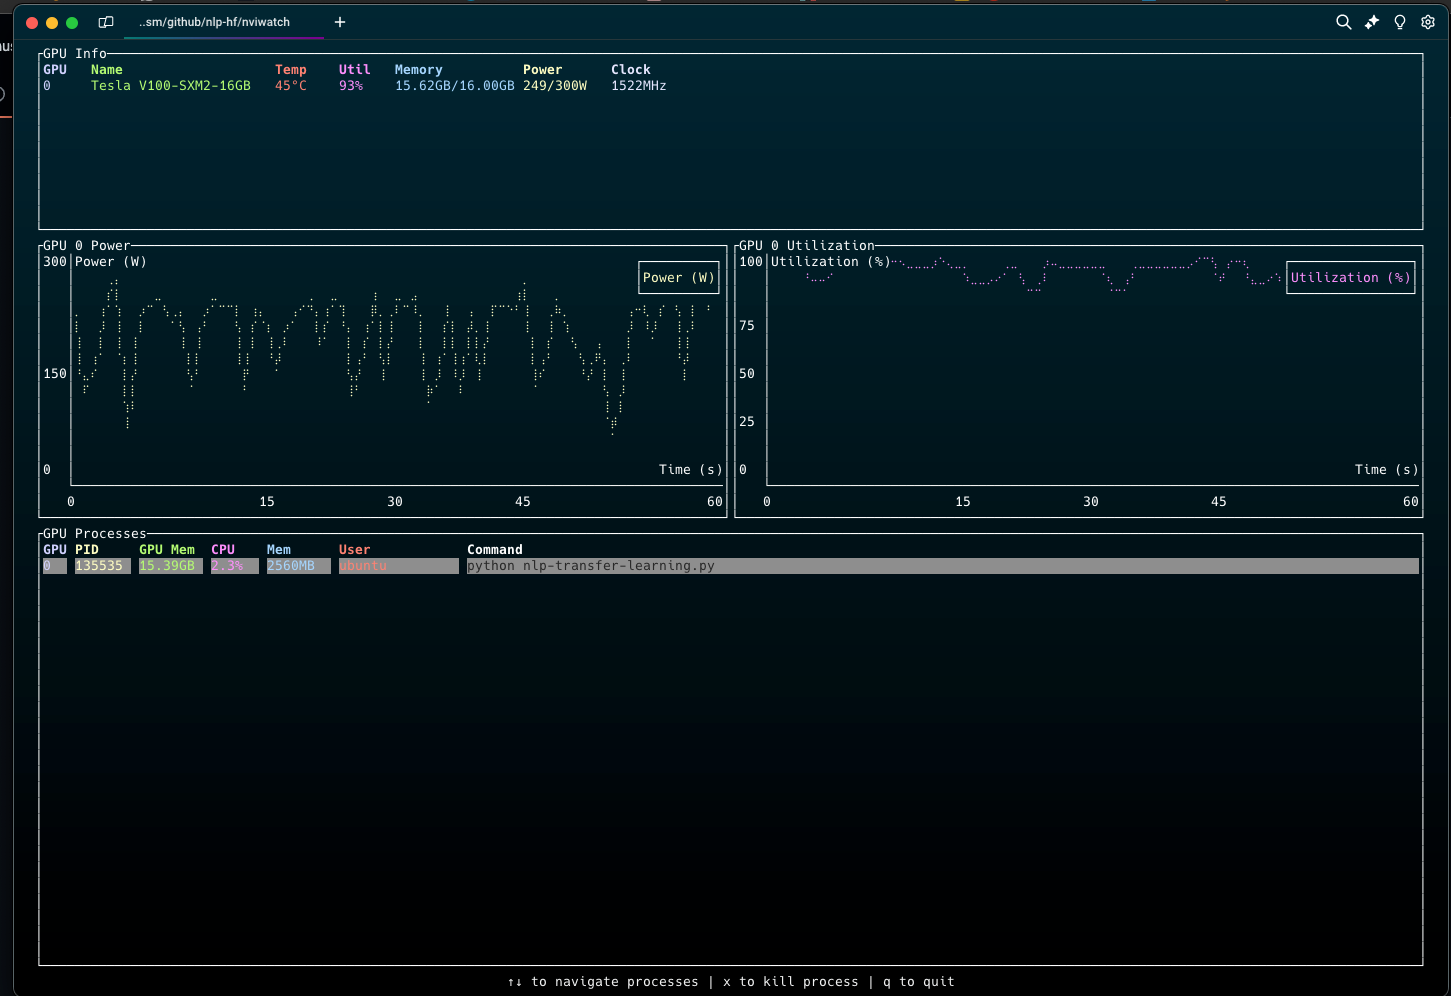
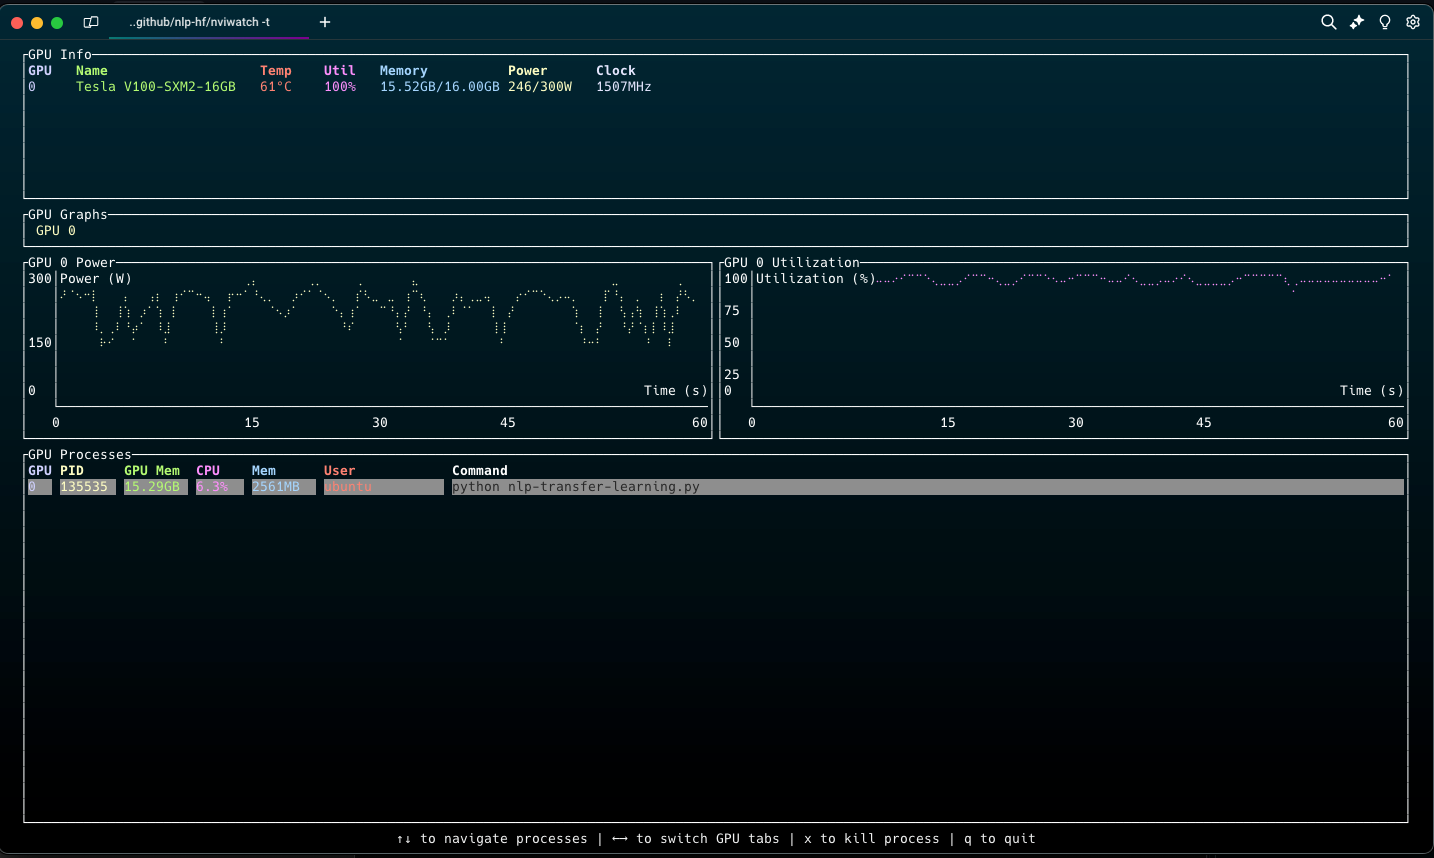
NviWatch is an interactive terminal user interface (TUI) application for monitoring NVIDIA GPU devices and processes. Built with Rust, it provides real-time insights into GPU performance metrics, including temperature, utilization, memory usage, and power consumption.
nviwatch_demo.mp4
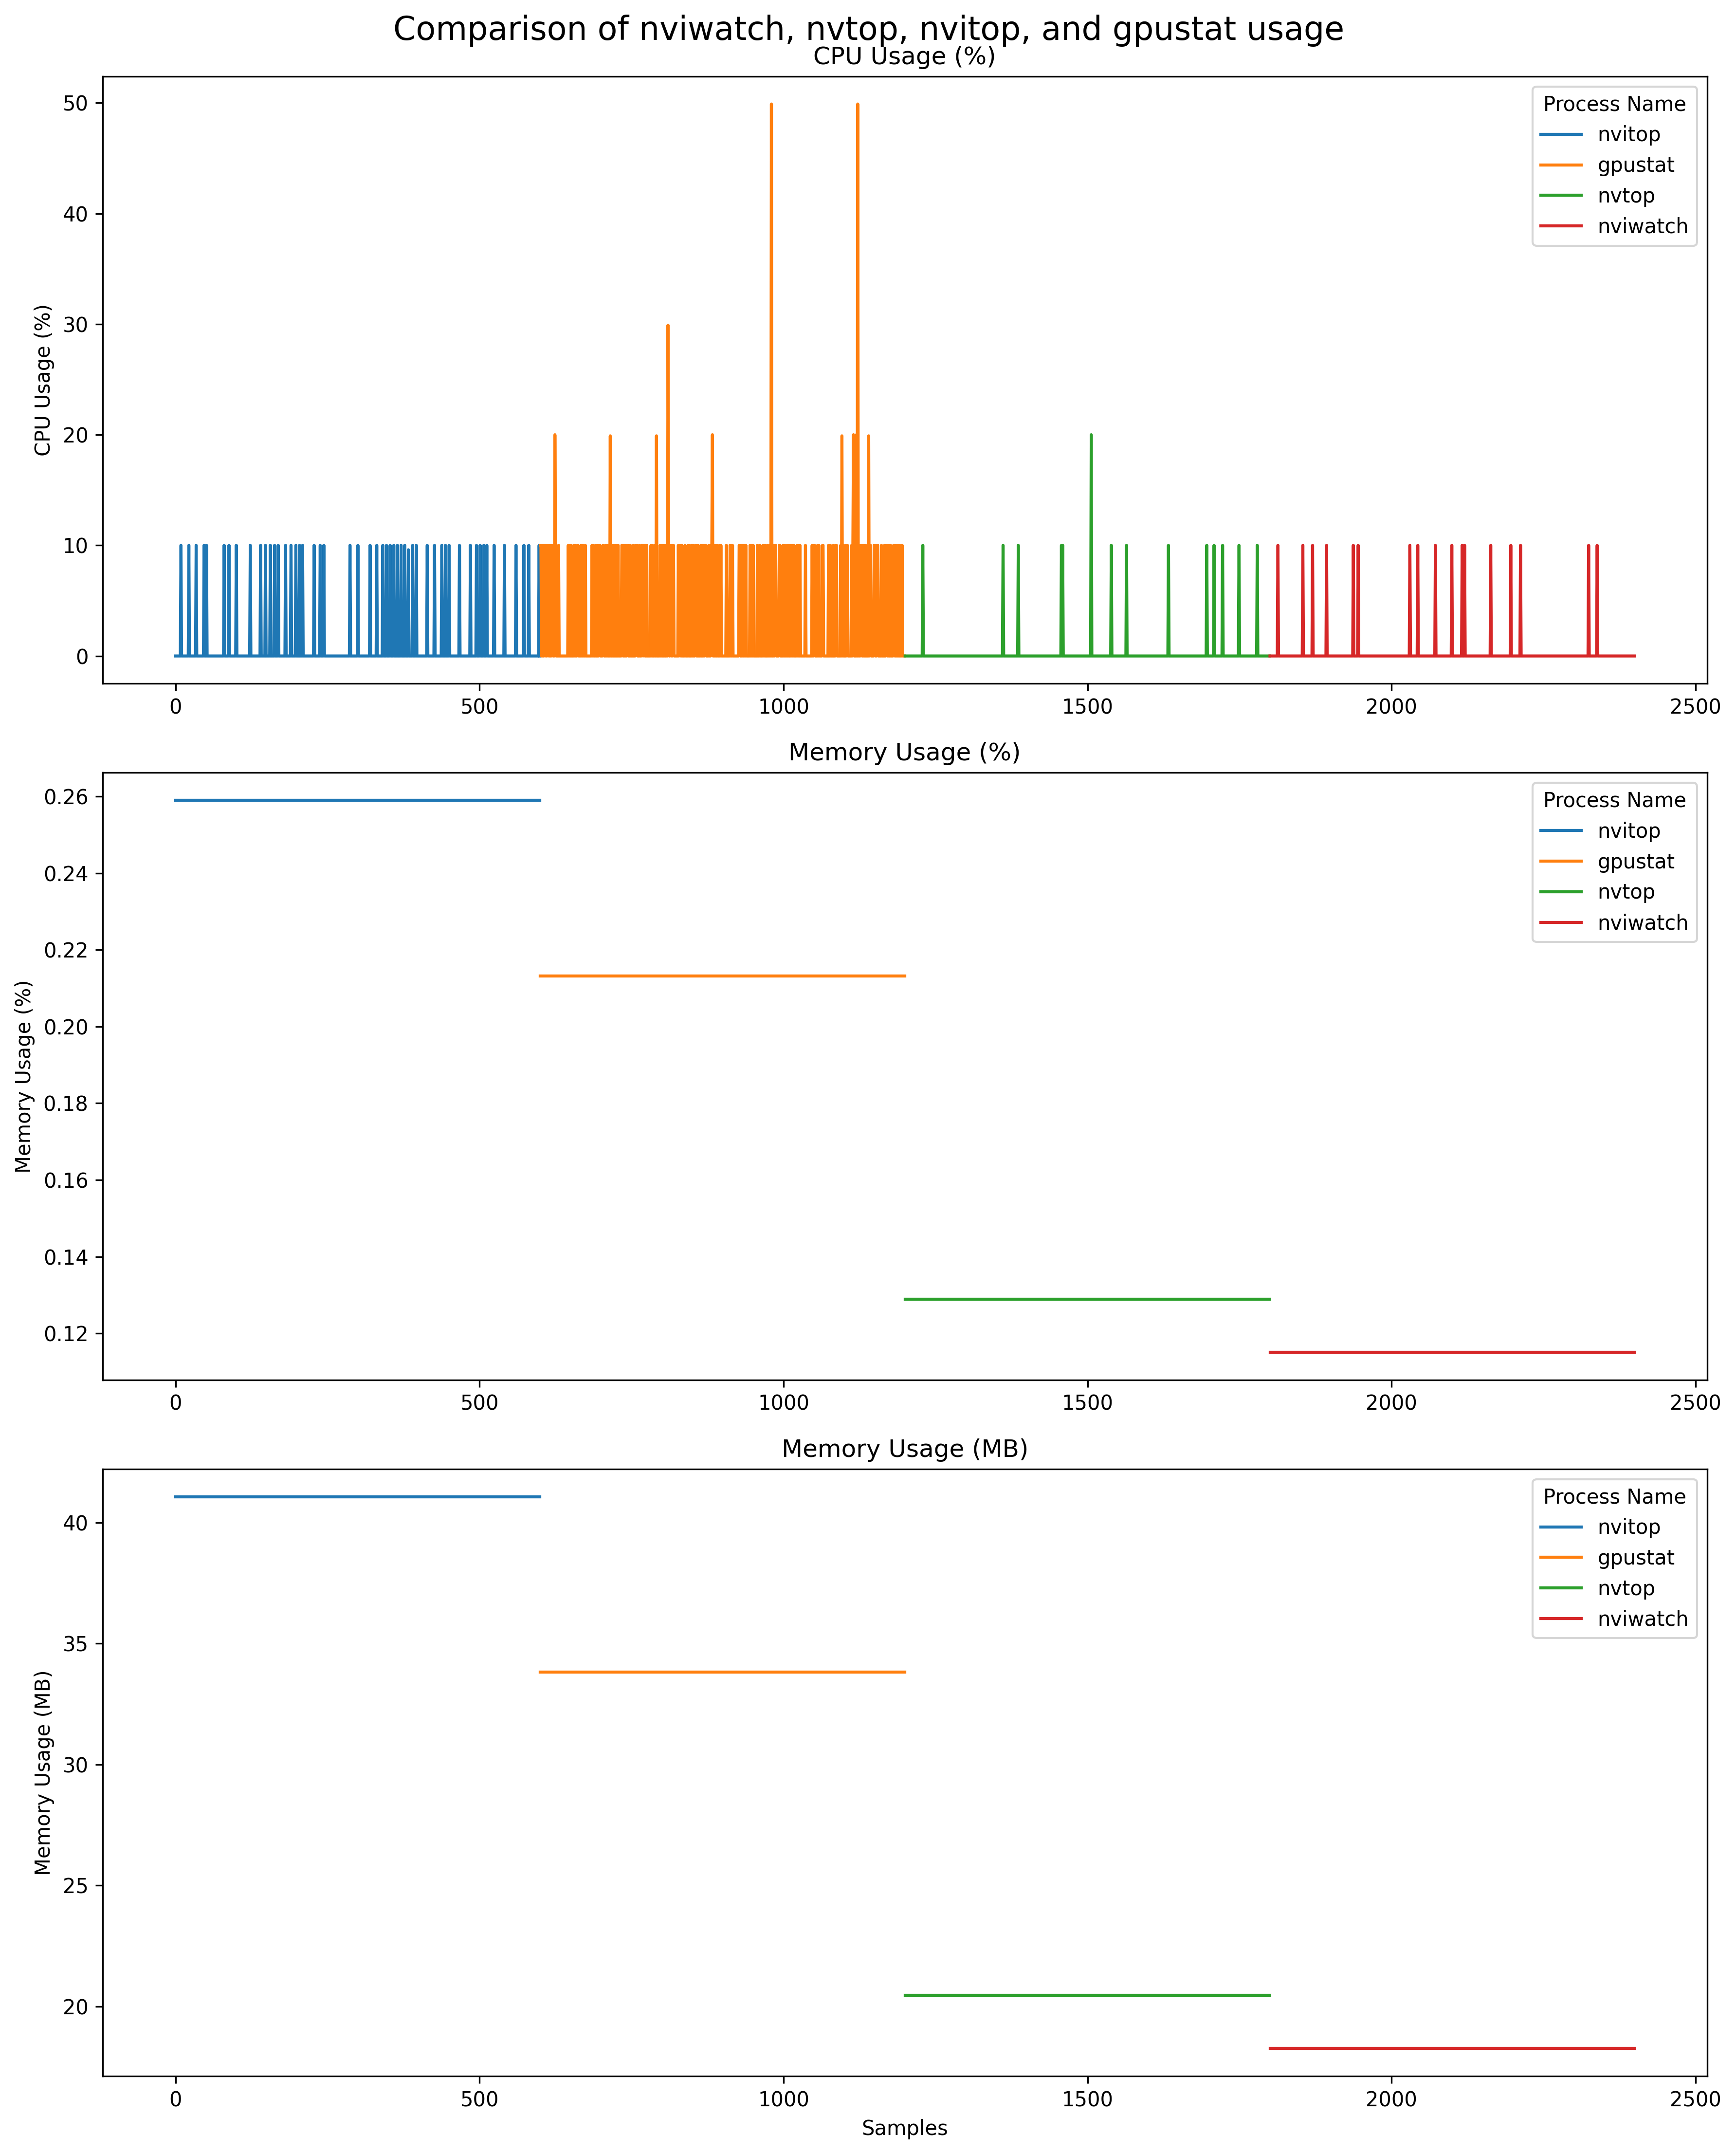
We conducted performance benchmarks comparing nviwatch with other popular GPU monitoring tools: nvtop, nvitop, and gpustat. The results demonstrate nviwatch's efficiency in terms of CPU and memory usage. All tools except nvitop were run at 100ms interval. nvitop was set to 250ms because that is the minimum allowed value. The benchmark scripts and logs are available in the benchmarks folder. The test system had 32 GB RAM.
| Tool | CPU Usage (%) | Memory Usage (%) | Memory Usage (MB) |
|---|---|---|---|
| Mean / Max | Mean / Max | Mean / Max | |
| nviwatch | 0.28 / 10.0 | 0.12 / 0.12 | 18.26 / 18.26 |
| nvtop | 0.25 / 20.0 | 0.13 / 0.13 | 20.46 / 20.46 |
| nvitop | 0.88 / 10.0 | 0.26 / 0.26 | 41.07 / 41.07 |
| gpustat | 3.47 / 49.9 | 0.21 / 0.21 | 33.82 / 33.82 |
We used python-package-size for determining the pip package sizes. For nvtop We used this apt show nvtop | grep Installed-Size.
| Tool | Package Size |
|---|---|
| nviwatch | 1.98 MB |
| nvitop | 4.1 MB |
| gpustat | 3.7 MB |
| nvtop | 106 KB |
-
CPU Usage: nviwatch demonstrates excellent CPU efficiency, with an average usage of just 0.28% and a maximum of 10%. It outperforms gpustat and nvitop and is comparable to nvtop in terms of average CPU usage. Important to note that nvtop supports more GPUs than just Nvidia so nviwatch isn't a complete alternative for nvwatch.
-
Memory Usage: nviwatch shows the lowest memory footprint among all tested tools, using only 0.12% of system memory on average, which translates to about 18.26 MB. This is notably less than nvitop (41.07 MB) and gpustat (33.82 MB), and slightly better than nvtop (20.46 MB).
-
Consistency: nviwatch maintains consistent memory usage throughout its operation, as indicated by the identical mean and max values for memory usage.
-
Package Size: At 1.98 MB, nviwatch offers a balanced package size. It's significantly smaller than nvitop (4.1 MB) and gpustat (3.7 MB), while being significantly larger than nvtop (106 KB).
- Real-Time Monitoring: View real-time data on GPU temperature, utilization, memory usage, and power consumption.
- Process Management: Monitor processes running on the GPU and terminate them directly from the interface.
- Graphical Display: Visualize GPU performance metrics using bar charts and tabbed graphs.
- Customizable Refresh Rate: Set the refresh interval for updating GPU metrics.
-
Go to the project's GitHub repository.
-
Navigate to the "Releases" section.
-
Download the latest binary release for linux.
-
Once downloaded, open a terminal and navigate to the directory containing the downloaded binary.
-
Make the binary executable with the following command:
chmod +x nviwatch -
You can now run the tool using:
./nviwatch
If you have Rust and Cargo installed on your system, you can easily install NviWatch directly from crates.io:
-
Open a terminal and run the following command:
cargo install nviwatch
-
Once the installation is complete, you can run NviWatch from anywhere in your terminal:
nviwatch
Note: Ensure you have the NVIDIA Management Library (NVML) available on your system before running NviWatch.
To build and run NviWatch, ensure you have Rust and Cargo installed on your system. You will also need the NVIDIA Management Library (NVML) available.
-
Clone the repository:
git clone https://github.com/msminhas93/nviwatch.git cd nviwatch -
Build the project:
cargo build --release
-
Run the application:
chmod +x ./target/release/nviwatch
./target/release/nviwatch
NviWatch provides a command-line interface with several options:
-w, --watch <MILLISECONDS>: Set the refresh interval in milliseconds. Default is 100 ms.-t, --tabbed-graphs: Display GPU graphs in a tabbed view.-b, --bar-chart: Display GPU graphs as bar charts.
Example:
./nviwatch --watch 500 --tabbed-graphs- q: Quit the application
- ↑/↓: Navigate through the list of processes
- ←/→: Switch between GPU tabs (when using tabbed graphs)
- x: Terminate the selected process
- d: Switch to default view mode
- t: Switch to tabbed graphs view mode
- b: Switch to bar charts view mode
The application supports three different view modes:
Shows all GPU information in a single view

Presents GPU information using bar charts

Displays GPU graphs in a tabbed interface

You can switch between these modes at any time using the corresponding key bindings.
This project is licensed under the GNU General Public License v3.0. See the LICENSE file for details.
Contributions are welcome! Please open an issue or submit a pull request for any improvements or bug fixes.
- Built with Rust and Ratatui.
- Utilizes the NVIDIA Management Library (NVML) via the nvml_wrapper crate.

