This is an app for monitoring GPUs on a single machine and across a cluster. You can use it to record various GPU measurements during a specific period using the context based loggers or continuously using the gpumon cli command. The context logger can either record to a file, which can be read back into a dataframe, or to an InfluxDB database. Data from the InfluxDB database can then be accessed using the python InfluxDB client or can be viewed in realtime using dashboards such as Grafana. Examples in Juypyter notebooks can be found here
When logging to influxdb the logger uses the Python bindings for the NVIDIA Management Library (NVML) which is a C-based API used for monitoring NVIDIA GPU devices. The performance of NVML is better and more efficient when compared to using nvidia-smi leading to a higher sampling frequency of the measurements.
Below is an example dashboard using the InfluxDB log context and a Grafana dashboard
To install simply either clone the repository
git clone https://github.com/msalvaris/gpu_monitor.gitThen install it:
pip install -e /path/to/repoFor now I recommend the -e flag since it is in active development and will be easy to update by pulling the latest changes from the repo.
Or just install using pip
pip install git+https://github.com/msalvaris/gpu_monitor.gitYou can also run it straight from a docker image (masalvar_gpumon).
nvidia-docker run -it masalvar/gpumon gpumon msdlvm.southcentralus.cloudapp.azure.com admin password gpudb 8086 gpuseriesfrom gpumon.file import log_context
from bokeh.io import output_notebook, show
output_notebook()# Without this the plot won't show in Jupyter notebook
with log_context('log.txt') as log:
# GPU code
show(log.plot())# Will plot the utilisation during the context
log()# Will return dataframe with all the logged propertiesClick here to see the example notebook
To do this you need to set up and install InfluxDB and Grafana. There are many ways to install and run InfluxDB and Grafana in this example we will be using Docker containers and docker-compose.
If you haven't got docker-compose installed see here for instructions
You must be also be able to execute the docker commands without the requirement of sudo. To do this in Ubuntu execute the following:
sudo groupadd docker
sudo usermod -aG docker $USER
If you haven't downloaded the whole repo then download the scripts directory. In there should be three files
The file example.env contains the following variables:
INFLUXDB_DB=gpudb
INFLUXDB_USER=admin
INFLUXDB_USER_PASSWORD=password
INFLUXDB_ADMIN_ENABLED=true
GF_SECURITY_ADMIN_PASSWORD=password
GRAFANA_DATA_LOCATION=/tmp/grafana
INFLUXDB_DATA_LOCATION=/tmp/influxdb
GF_PATHS_PROVISIONING=/grafana-conf
Please change them to appropriate values. The data location entries (GRAFANA_DATA_LOCATION, INFLUXDB_DATA_LOCATION) will tell Grafana and InfluxDB where to store their data so that when the containers are destroyed the data remains. Once you have edited it rename example.env to .env.
Now inside the folder that contains the file you can run the command below and it will give you the various commands you can execute.
makeTo start InfluxDB and Grafana you run
make runNow in your Jupyter notebook simply add these lines
from gpumon.influxdb import log_context

with log_context('localhost', 'admin', 'password', 'gpudb', 'gpuseries'):
	# GPU Code
Make sure you replace the values in the call to the log_context with the appropriate values. gpudata is the name of the database and gpuseries is the name we have given to our series, feel free to change these. If the database name given in the context isn't the same as the one supplied in the .env file a new database will be created. Have a look at this notebook for a full example.
If you want to use the CLI version run the following command:
gpumon localhost admin password gpudb --series_name=gpuseriesThe above command will connect to the influxdb database running on localhost with
user=admin
password=password
database=gpudb
series_name=gpuseries
You can also put your parameters in a .env file in the same directory as you are executing the cli logger or the logging context and the necessary information will be pulled from it. You can also pass commands to them and these will override what is in your .env file
By default a datasource and dashboard are set up for you if everything went well above GPU metrics should be flowing to your database. You can log in to Grafana by pointing a browser to the IP of your VM or computer on port 3000. If you are executing on a VM make sure that port is open. Once there log in with the credentials you specified in your .env file.
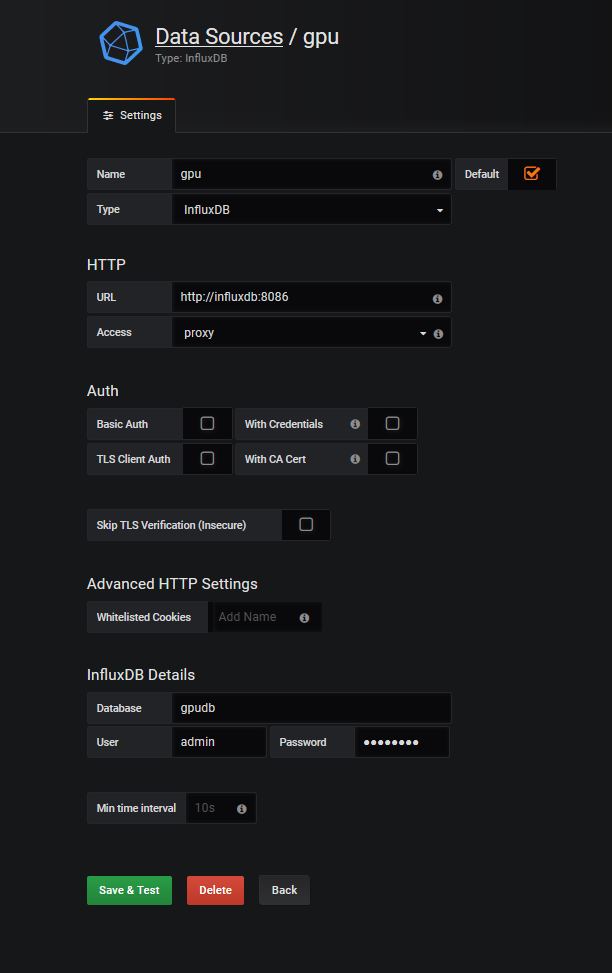
Below is an example screen-shot of the datasource config
Once that is set up you will need to also set up your dashboard. The dashboard shown in the gif above can be found here and is installed by default.

