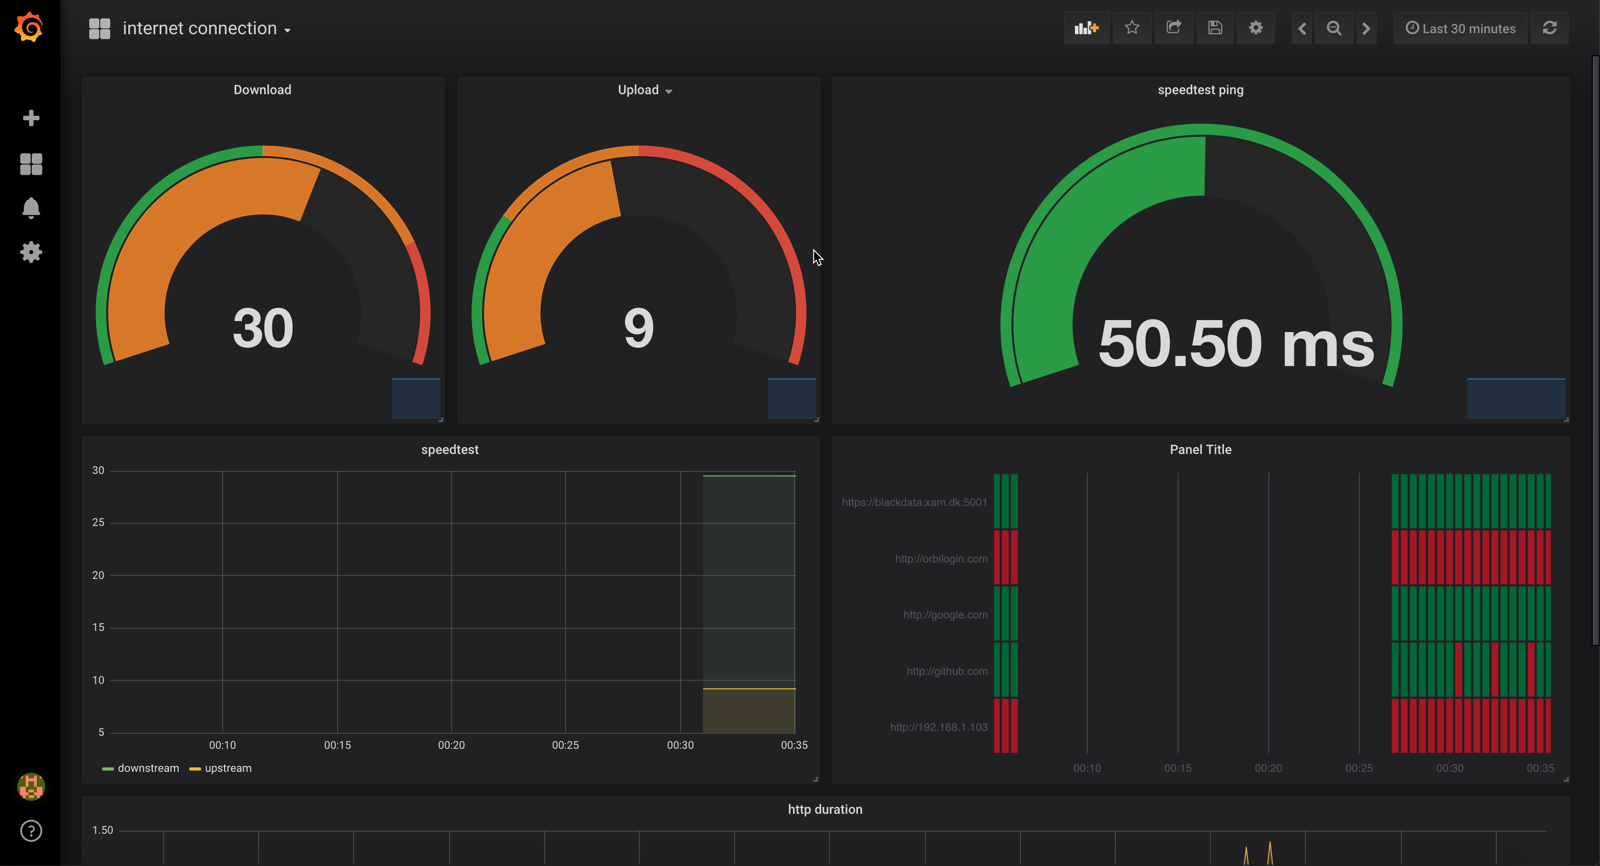
Stand-up a Docker Prometheus stack containing Prometheus, Grafana with blackbox-exporter, and speedtest-exporter to collect and graph home Internet reliability and throughput.
Make sure Docker and Docker Compose are installed on your Docker host machine.
git clone https://github.com/mrichardson03/internet-monitoring
cd internet-monitoring
docker-compose up -d
Go to http://localhost:3030/d/o9mIe_Aik/internet-connection
(change localhost to your docker host ip/name).
To change what hosts you are monitoring, change the targets sections in
/prometheus/http_hosts.yml and /prometheus/ping_hosts.yml
for either HTTP or ICMP status checks.
To adjust how often the checks are run, adjust scrape_interval in
/prometheus/prometheus.yml for each type of check. HTTP and ICMP status checks run every
5 minutes, and speed tests run every 30 minutes.
Once configurations are done, run the following command:
$ docker-compose up -d
That's it. docker-compose builds the entire Grafana and Prometheus stack automagically.
The Grafana Dashboard is now accessible via: http://<Host IP Address>:3030 for example http://localhost:3030
username - admin
password - wonka (Password is stored in the config.monitoring env file)
The data source and dashboard for Grafana are automatically provisioned.
If all works it should be available at http://localhost:3030/d/o9mIe_Aik/internet-connection - if no data shows up try change the time duration to something smaller.
http://localhost:9090/targets shows the status of monitored targets as seen from Prometheus.
http://localhost:9090/graph?g0.expr=&g0.tab=1&g0.stacked=0&g0.range_input=1h for exploring the values stored in the
Prometheus time series. Interesting values here are probe_http_status_code and probe_icmp_duration_seconds.
http://localhost:9115 is the blackbox_exporter endpoint.
http://localhost:9798/metrics speedtest exporter endpoint. This takes about 30 seconds to show its result, since it runs an actual speedtest when requested.
Thanks to @maxandersen, @geerlingguy for making the original project(s) this fork is based on.
Thanks to @vegasbrianc work on making a super easy docker stack for running prometheus and grafana.
This setup is not secured in any way, so please only use on non-public networks, or find a way to secure it on your own.
