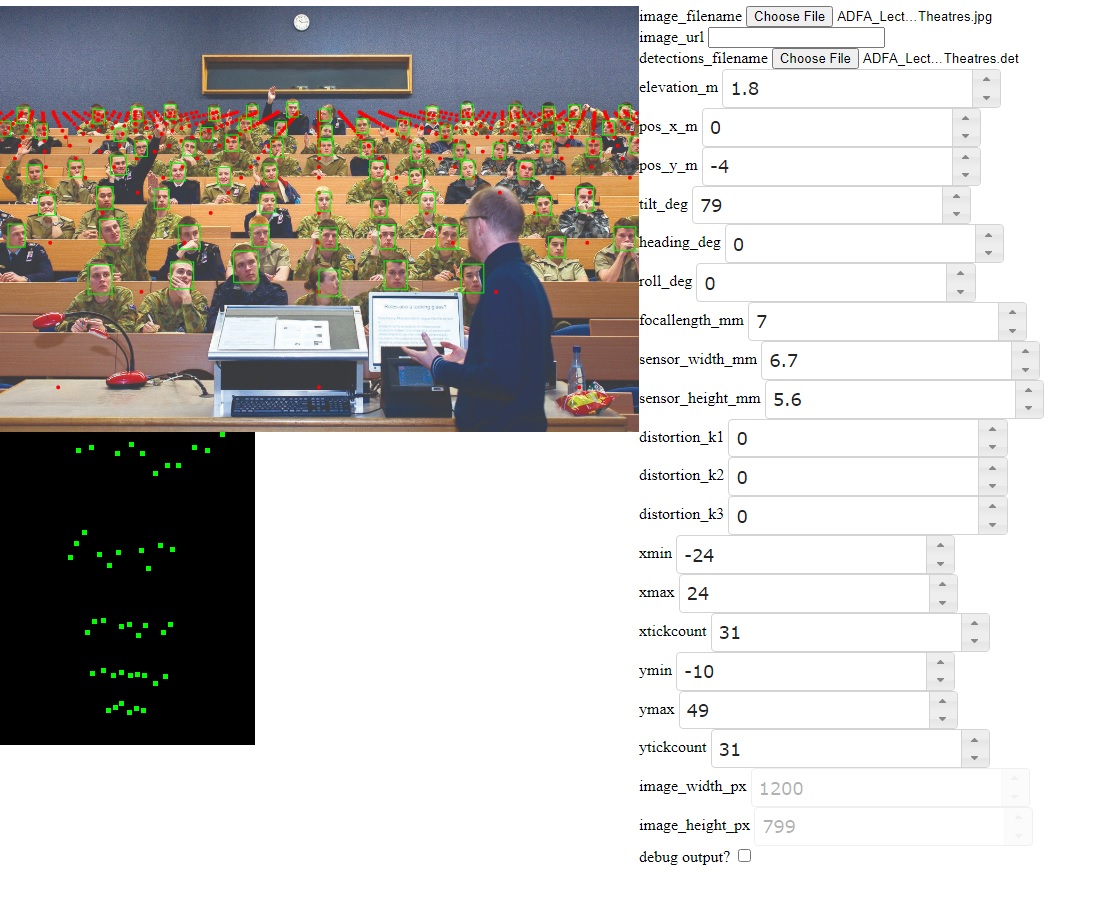
Cameratransform viewer
Simple utility to help visualise the effect of different cameratransform settings.
Configuration
The beginning of ct.js can be edited
cturl: change if you are puttingct.pyin a different webspace or you wish to use the Huggingface backend (now default) or a different URL.
Installation
Put the files index.html, ct.py and styles.css in a web-accessible folder somewhere that Python scripts can be CGI-executed and direct your browser to index.html.
Alternatively, run ln -s . cgi-bin and then you can use the python web server in the current directory. Set configuration parameter cturl to cgi-bin/ct.py and run python3 -m http.server 8080 or whichever port you like.
Usage
The interface is very simplistic and simply gives you a handle on many different parameters you can tweak for cameratransform. You can specify an image file to project the coordinates on. This image file IS NOT UPLOADED to the server! It is entirely client-side. The only data that goes to and from the server are numbers for the parameters and coordinates for the points. All drawing is done on the client-side.
The image may be specified also as a URL instead, if you would rather use a publicly-accessible image from the web.
Each of the numerical parameters is specified using a number spinner, so you can easily tab around and use up/down arrows to fiddle with the values. The webpage automatically updates the output when you stop changing things for a few hundred milliseconds, so if you hold down the arrow key and change the numbers fast it will wait until you are finished before updating.
The output shows the image with a grid of points (in red) projected onto it. This grid is the projection of a 2-D grid plotted on the X and Y axes (the ground, essentially). The grid is specified by xmin,xmax,ymin,ymax and the density of points by xtickcount,ytickcount.
You may also specify a 'detections' file. This is a JSON file with a certain format showing bounding boxes for detected features (e.g. faces) in the image. The expected format of the detections file is: [{'x': ..., 'y':, ..., 'w': ..., 'h': ...}, ...] specifying the (x,y)-coords with width and height, all in pixels relative to the image in question. See the [https://github.com/AdaptiveCity/room_count] tool for producing detections files.
These detections are sent to the server and transformed (reverse-projected). The resulting top-down view is shown below the image, showing where cameratransform thinks each detection is located in the image if it were possible to get a view from directly above.
For convenience, any changed parameters are reflected in the URL. Therefore, you can bookmark, copy/paste or somehow save the URL in order to save the parameters of interest.
Parameter descriptions
elevation_m: camera height in metres above the groundpos_x_m: camera location on the X axis, in metrespos_y_m: camera location on the Y axis, in metrestilt_deg: camera tilt in degrees (0 is straight down, 90 is 'looking forward')heading_deg: camera heading in degrees (0 is straight ahead, -90 is left and 90 is right)roll_deg: camera roll in degrees (0 is level with the ground)focallength_mm: camera focal length in millimetressensor_width_mm: camera sensor width in millimetressensor_height_mm: camera sensor height in millimetres- defaults for the above 3 parameters chosen to roughly correspond to Raspberry Pi camera
distortion_k1: The K1 parameter for the Brown distortion modeldistortion_k2: The K2 parameter for the Brown distortion modeldistortion_k3: The K3 parameter for the Brown distortion model- If using a fisheye lens some careful calibration is needed of the above 3 parameters
xmin: minimal boundary of the red dot grid, X axisxmax: maximal boundary of the red dot grid, X axisxtickcount: number of dots to draw along the X axisymin: minimal boundary of the red dot grid, Y axisymax: maximal boundary of the red dot grid, Y axisytickcount: number of dots to draw along the Y axisimage_width_px: pixel width of the image (not editable)image_height_px: pixel height of the image (not editable)debug_output: show the behind-the-scenes JSON (very spammy)
