Instrumenting a Django server with Prometheus.
[Amazon customers seeking distributed tracing should probably have a look at X-Ray first.]
Prometheus is a monitoring and visualization tool that can easily be used to instrument Kubernetes.
This follows on from my Cloud Django exercise.
-
Download the latest stable release for your platform.
[At the time of writing this is
prometheus-2.1.0.linux-amd64.tar.gz] -
Note the checksum.
[At the time of writing this is
f181f619c9a8e0750c1ac940eb00a0881cc50386d896f06f159e9a5b68db60a0] -
Verify the checksum (SHA 256 Checksum):
$ sha256sum prometheus-2.1.0.linux-amd64.tar.gz
-
Uncompress it (using
tarorarkor whatever floats your boat).
There is also a Docker image:
prom/prometheus:v2.1.0
As usual, I do not recommend global installs:
$ pip install --user -r requirements.txt
[Replace pip with pip3 for Python3.]
-
Change INSTALLED_APPS and MIDDLEWARE in
polls/polls/settings.pyas follows:$ diff -uw ../Cloud_Django/polls/polls/settings.py polls/polls/settings.py --- ../Cloud_Django/polls/polls/settings.py 2018-03-05 19:44:19.563484080 -0800 +++ polls/polls/settings.py 2018-03-06 13:52:20.469803146 -0800 @@ -39,9 +39,11 @@ 'django.contrib.sessions', 'django.contrib.messages', 'django.contrib.staticfiles', + 'django_prometheus', ] MIDDLEWARE = [ + 'django_prometheus.middleware.PrometheusBeforeMiddleware', 'django.middleware.security.SecurityMiddleware', 'django.contrib.sessions.middleware.SessionMiddleware', 'django.middleware.common.CommonMiddleware', @@ -49,6 +51,7 @@INSTALLED_APPS 'django.contrib.auth.middleware.AuthenticationMiddleware', 'django.contrib.messages.middleware.MessageMiddleware', 'django.middleware.clickjacking.XFrameOptionsMiddleware', + 'django_prometheus.middleware.PrometheusAfterMiddleware', ] ROOT_URLCONF = 'polls.urls' $Note that
PrometheusBeforeMiddlewareandPrometheusAfterMiddlewaremust sandwich the middleware exactly as shown. -
Change
polls/polls/urls.pyas follows:$ diff -uw ../Cloud_Django/polls/polls/urls.py polls/polls/urls.py --- ../Cloud_Django/polls/polls/urls.py 2018-02-11 14:45:15.909210000 -0800 +++ polls/polls/urls.py 2018-03-06 13:40:28.043185705 -0800 @@ -20,4 +20,5 @@ urlpatterns = [ url(r'^polls/', include('polls_app.urls')), url(r'^admin/', admin.site.urls), + url('', include('django_prometheus.urls')), ] $[This will create a
/metricsendpoint for Prometheus to query.]
Change DATABASES in polls/polls/urls.py as follows:
$ diff -uw ../Cloud_Django/polls/polls/settings.py polls/polls/settings.py
--- ../Cloud_Django/polls/polls/settings.py	2018-03-05 19:44:19.563484080 -0800
+++ polls/polls/settings.py	2018-03-06 13:52:20.469803146 -0800
@@ -77,11 +80,11 @@

 DATABASES = {
     'default': {
-        'ENGINE': 'django.db.backends.postgresql_psycopg2',
+        'ENGINE': 'django_prometheus.db.backends.postgresql',
         'NAME': 'polls',
         'USER': 'postgres',
         'PASSWORD': 'postgres',
         'HOST': '127.0.0.1',
         'PORT': 5432
     }
 }
$
Change polls/polls_app/models.py as follows:
$ diff -uw ../Cloud_Django/polls/polls_app/models.py polls/polls_app/models.py
--- ../Cloud_Django/polls/polls_app/models.py	2018-02-11 16:46:40.063097000 -0800
+++ polls/polls_app/models.py	2018-03-06 13:44:18.300155164 -0800
@@ -4,9 +4,12 @@
 from django.db import models
 from django.utils.encoding import python_2_unicode_compatible

+from django_prometheus.models import ExportModelOperationsMixin
+

 @python_2_unicode_compatible
-class Question(models.Model):
+#class Question(models.Model):
+class Question(ExportModelOperationsMixin('question'), models.Model):
     question_text = models.CharField(max_length=200)
     pub_date = models.DateTimeField('date published')
     def __str__(self):
@@ -14,7 +17,8 @@


 @python_2_unicode_compatible
-class Choice(models.Model):
+#class Choice(models.Model):
+class Choice(ExportModelOperationsMixin('choice'), models.Model):
     question = models.ForeignKey(Question, on_delete=models.CASCADE)
     choice_text = models.CharField(max_length=200)
     votes = models.IntegerField(default=0)
$
This will export 6 counters:
django_model_inserts_total{model="question"}
django_model_updates_total{model="question"}
django_model_deletes_total{model="question"}

django_model_inserts_total{model="choice"}
django_model_updates_total{model="choice"}
django_model_deletes_total{model="choice"}
These will show in the Prometheus UI grouped as django_model_inserts_total, django_model_updates_total
and django_model_deletes_total.
Django migrations are also monitored. Two gauges are exported, django_migrations_applied_by_connection
and django_migrations_unapplied_by_connection. It may be desirable to alert if there are unapplied migrations.
At this point we could instrument our application code, however we have already managed to get quite a lot of visibility into our application with a fairly minimal effort. We can instrument our application code as needed from this point forward.
Run it as follows (as usual, Ctrl-C to kill):
$ ./prometheus-2.1.0.linux-amd64/prometheus --config.file=prometheus.yaml
This will launch a web server at:
0.0.0.0:9090
[It will also create a data directory for the prometheus stats.]
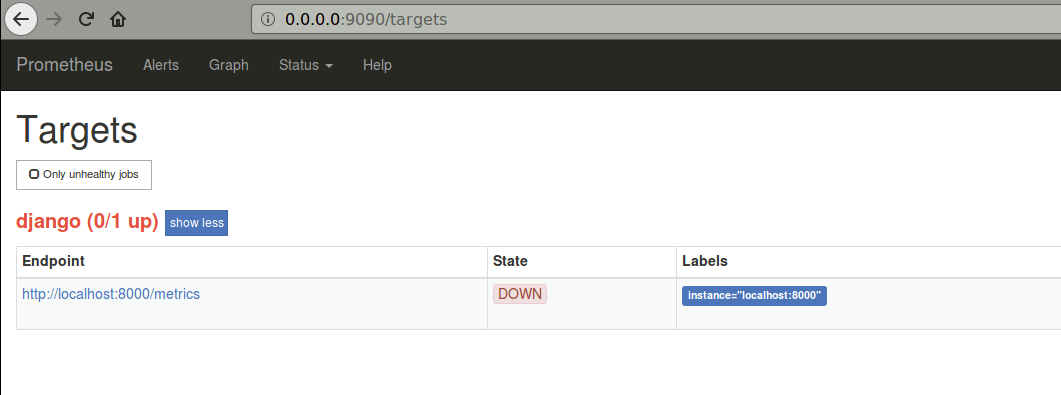
At this point, Prometheus should show our app as DOWN:
Lets launch our web app so Prometheus has something to track:
$ python manage.py runserver
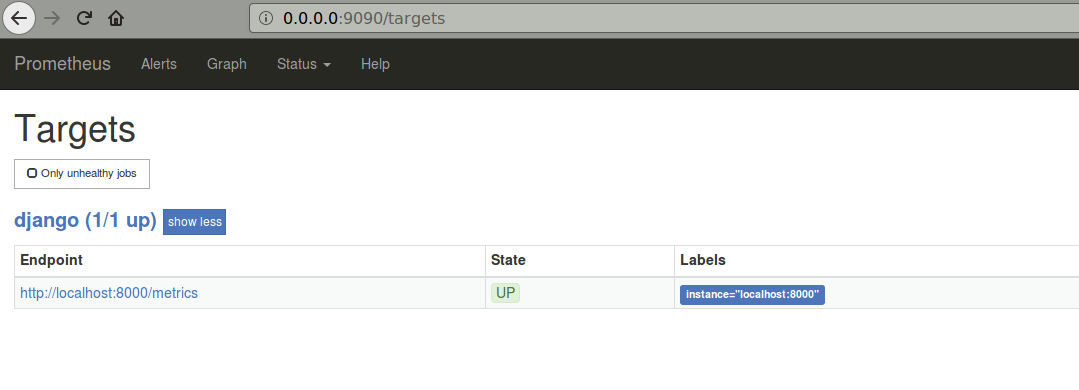
At this point, Prometheus should show our app as UP:
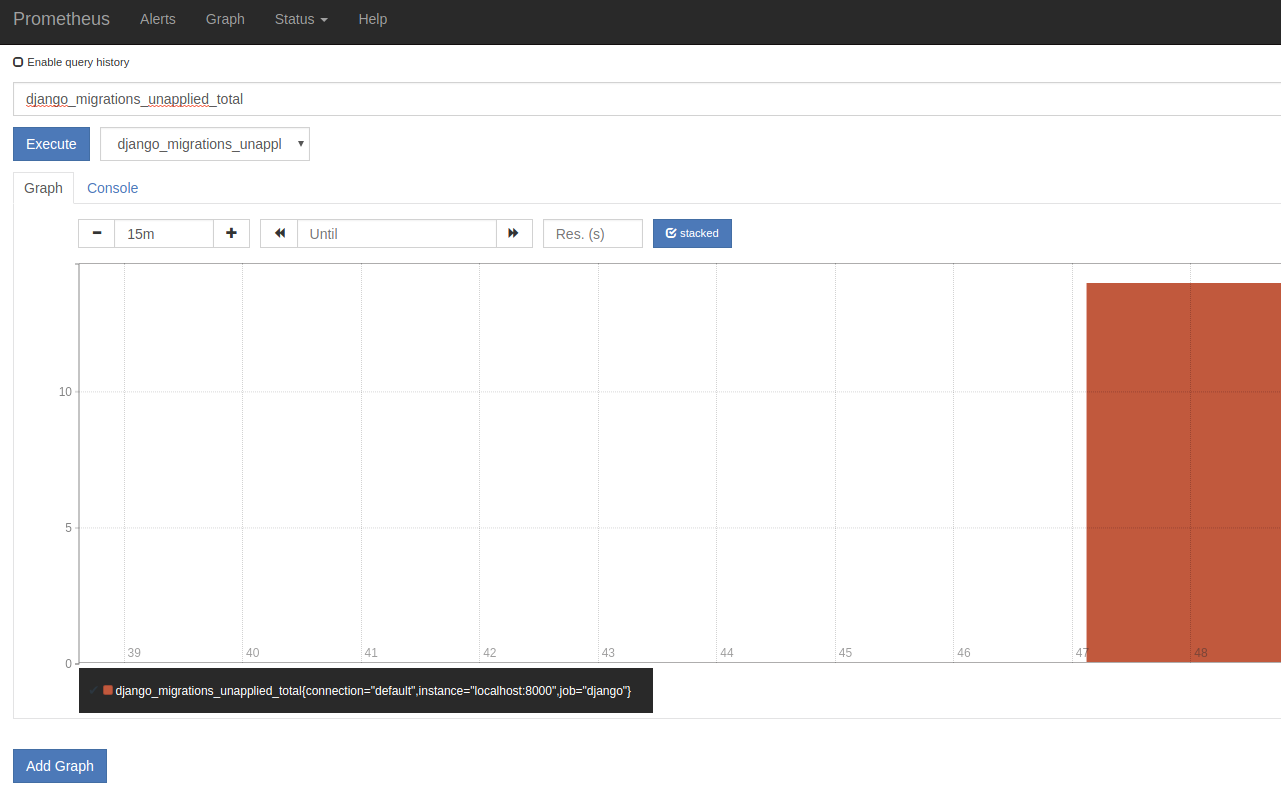
And there are 14 migrations unapplied:
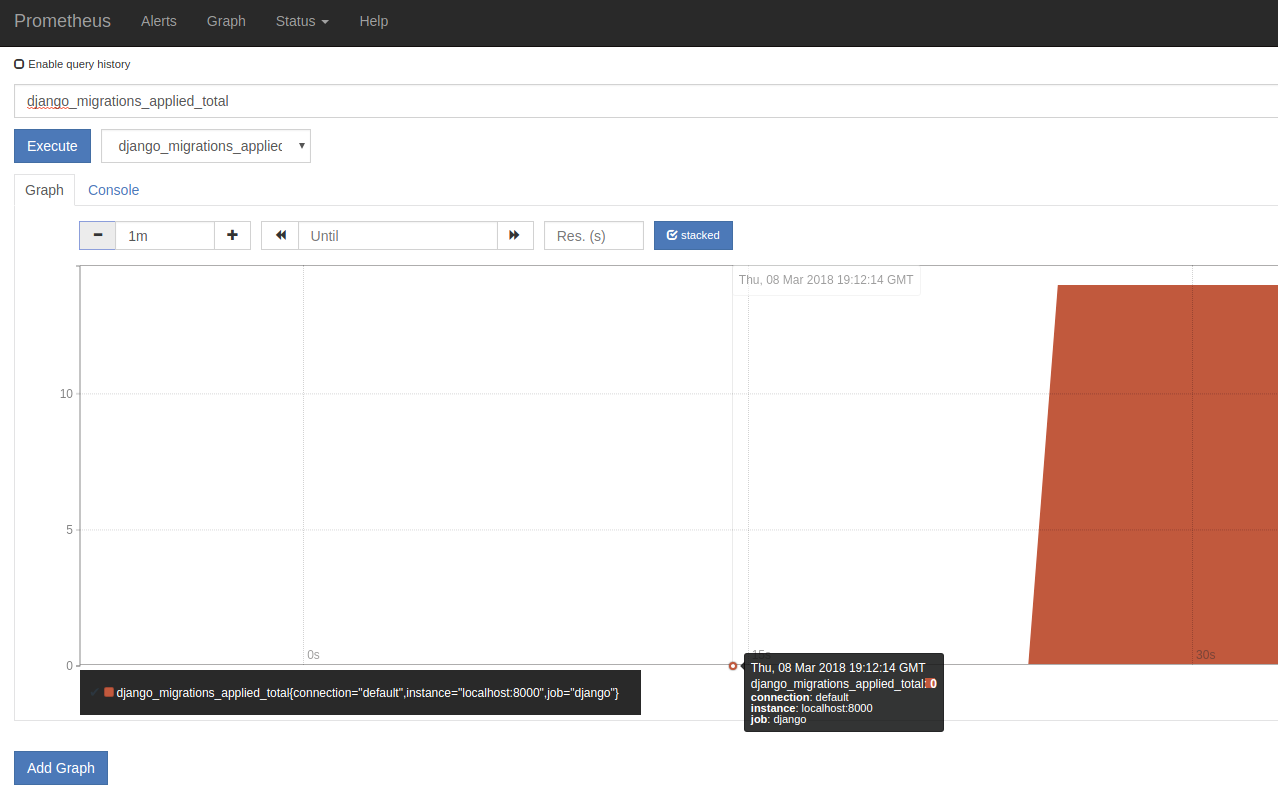
Lets run them:
$ python manage.py migrate
It's possible to do quite a bit with Prometheus, but for dashboarding Grafana may be a better choice.
Naming:
https://prometheus.io/docs/practices/naming/
Instrumentation:
https://prometheus.io/docs/practices/instrumentation/
Robust Perception offers a free introduction to Prometheus:
https://training.robustperception.io/p/introduction-to-prometheus
Prometheus has a sophisticated Query Language. The following articles from Prometheus co-creator Julius Volz provide a deep dive into this:
https://www.digitalocean.com/community/tutorials/how-to-query-prometheus-on-ubuntu-14-04-part-1

https://www.digitalocean.com/community/tutorials/how-to-query-prometheus-on-ubuntu-14-04-part-2
- Prometheus 2.1.0
- Django 1.11.10
- Docker 17.12.1-ce (Client and Server)
- kubectl (Client: v1.8.6, Server: v1.9.0)
- Kubernetes v1.9.0
- minikube v0.25.0
- psycopg2 2.7.4
- Python 2.7.12
- PostgreSQL 10.2
- Learn Prometheus's Query Language
Based on:
https://github.com/korfuri/django-prometheus
And:
https://github.com/prometheus/client_python


