No More Blue
Liven up your matplotlib scatter maps
Motivation
Muted blues have been the go to corporate colour for ages (think IBM or Microsoft)
but are less than ideal for visualizing multivariate relationships. Here we cycle through
all of the available matplotlib colour schemes, allowing you to choose a pleasing one.
[There may well be more colour schemes available - but not yet installed.]
Of course there is also seaborn - but that may be overkill for many use cases. Even so, we will install it so its colour schemes are available.
Prerequisites
Python and pip obviously.
Install the rest as follows:
$ pip install --user -r requirements.txt
[Replace with pip3 for Python 3.]
Data
We will use the well-known Iris dataset.
Use
Run plot_style.py by typing python plot_style.py.
Close the displayed graphs if they do not conform to your aesthetics.
Once you find a style you like, make a note of the final displayed style:
$ python plot_style.py
seaborn-darkgrid
seaborn-notebook
classic
seaborn-ticks
grayscale
bmh
seaborn-talk
dark_background
ggplot
fivethirtyeight
_classic_test
seaborn-colorblind
^C$
In the example shown above, this would be seaborn-colorblind.
[You can continue through the rest of the available styles - perhaps you may find a style that is even more pleasing - or else type Ctrl-C to terminate.]
Examples
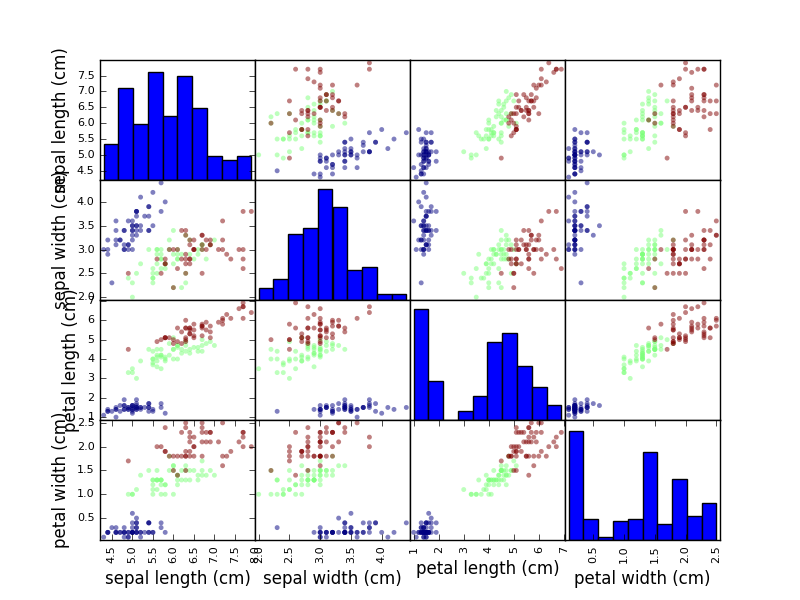
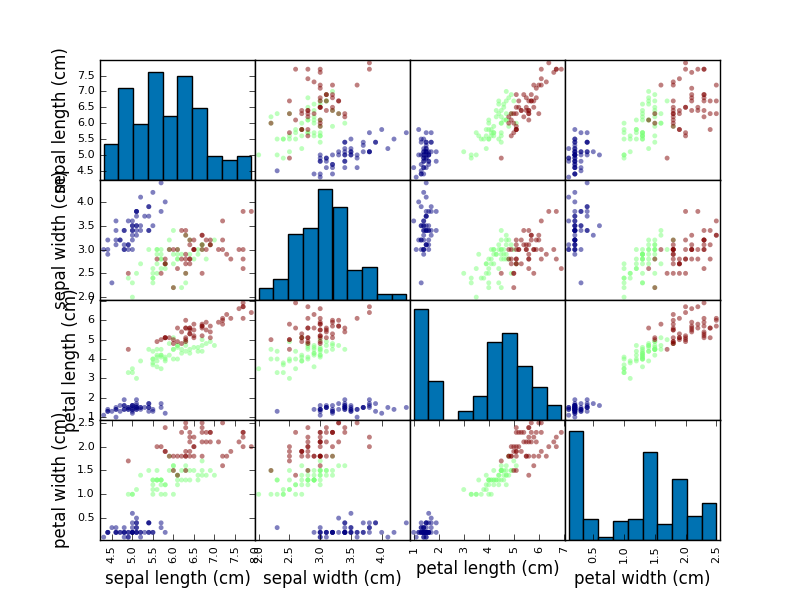
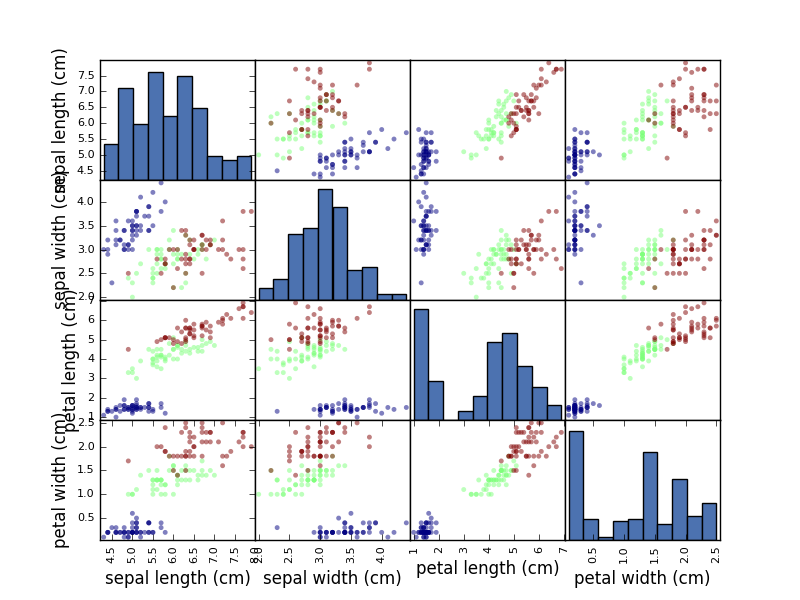
The following are some examples of colour styles:
Classic
[Probably a good default choice for most uses, although I think the green is hard to read.]
Seaborn Colorblind
[Probably a better default choice for most uses, although the green is hard to scan.]
Seaborn Deep
[A nice variation on the Colorblind scheme but the green is still hard to read.]
Reference
Matplotlib style gallery:
http://matplotlib.org/gallery.html#style_sheets
Seaborn:
http://seaborn.pydata.org/tutorial.html
To Do
- Investigate creating a scheme with an easier-to-scan green
Credits
Inspired by one of the answers to this StackOverflow question:
https://stackoverflow.com/questions/46383645/seaborn-and-pd-scatter-matrix-plot-color-issues


