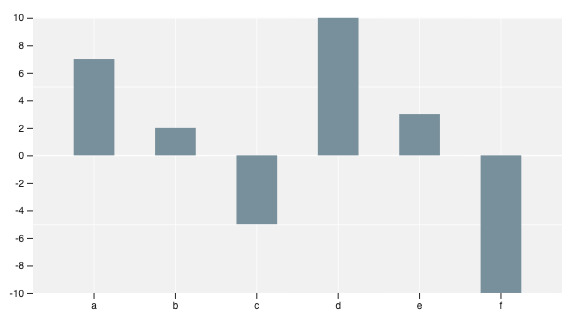
Using React.js and D3.js to build simple and reusable components for data visualizations on the web.
# yarn
yarn add react-d3-ggplot

# npm
npm install react-d3-ggplot| Props | Description |
|---|---|
| data | An array of objects |
| aes (aesthetics) | An array with two strings |
| dimensions | An object: width, height, padding |
import React from 'react';
import { useState } from 'react';
import { GEOMS } from 'react-d3-ggplot';
import { XAxis } from 'react-d3-ggplot';
import { YAxis } from 'react-d3-ggplot';
import { Line } from 'react-d3-ggplot';

const LineChart = () => {
  const [state, setState] = useState({
    data: [{ x: 0, y: 0 }, { x: 10, y: 10 }],
    aes: ['x', 'y'],
    dimensions: { width: 500, height: 300, padding: 50 }
  });

  return (
    <GEOMS {...state}>
      <XAxis />
      <YAxis />
      <Line />
    </GEOMS>
  );
};


