
Quantitative analysis techniques with Python and Pandas, for investors to determine which portfolio is performing the best across many areas: volatility, returns, risk, and Sharpe ratios.
I created a tool (an analysis notebook) that analyzes and visualizes the major metrics of the portfolios across all of these areas, and determine which portfolio outperformed the others. I have used historical daily returns of several portfolios: some from an algorithmic portfolios, some that represent the portfolios of famous "whale" investors like Warren Buffett, and some from the big hedge and mutual funds. then I used this analysis to create a custom portfolio of stocks (TGT ,TJX, WMT) and compared its performance to that of the other portfolios, as well as the larger market (S&P 500).
-
Used Pandas to read in each of the CSV files as a DataFrame and converted the dates to a
DateTimeIndex.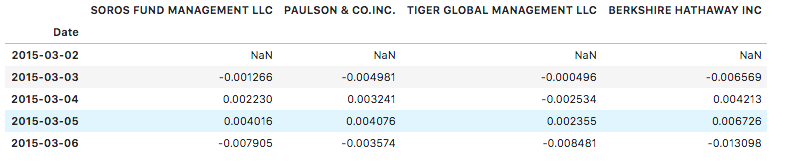
-
Detected and removed null values.


- Removed dollar signs from the numeric values and converted the data types as needed.

            ||
            ||
            \/

- Converted the S&P 500 closing prices to daily returns.

- concatenated
Whale Returns,Algorithmic Returns, and theS&P 500 Returnsinto a single DataFrame with columns for each portfolio's returns.

Analyzed the data to see if any of the portfolios outperform the stock market (i.e., the S&P 500).
- Calculated and plotted cumulative returns. checked if any portfolio outperform the S&P 500.

- Created a box plot for each of the returns. To determine which box has the largest spread and Which has the smallest spread.

- Calculated the standard deviation for each portfolio. To determine which portfolios are riskier than the S&P 500.

- Plotted the rolling standard deviation of the firm's portfolios along with the rolling standard deviation of the S&P 500. To determine if the risk increase for each of the portfolios at the same time risk increases in the S&P.

- Constructed a correlation table for the algorithmic, whale, and S&P 500 returns.To determine Which returns most closely mimic the S&P.

- Picked BERKSHIRE HATHAWAY INC and plotted a rolling beta between that portfolio's returns and S&P 500 returns. To determine if the portfolio sensitive to movements in the S&P 500.

Used the daily returns, calculated and visualized the Sharpe ratios using a bar plot.
