A very simple Prometheus exporter that exposes metrics from Cloudflare's colocations API as described in the API documentation. Sadly, this is for Cloudflare Enterprise customers only. It'll expose metrics per PoP and shows requests, bandwidth and threats.
Please note that because of how the Cloudflare API works this exporter will only return statistics from now() - 5 minutes.
In addition, the exporter will also fetch DNS analytics. Exporting metrics per records queried at edge resolvers per PoP.
The following roles are required:
- Analytics Administrator
- Firewall Administrator
Running the container:
docker run \
 -d \
 -p 9199:9199 \
 -e ZONE=example.com \
 -e AUTH_KEY=deadbeefcafe \
 -e AUTH_EMAIL=admin@example.com \
 wehkamp/prometheus-cloudflare-exporter:1.0
The exporter exposes the following metrics, all returned per PoP:
| Name | Description | Type |
|---|---|---|
cloudflare_pop_received_requests |
cached and uncached requests received on an edge-location | gauge |
cloudflare_pop_bandwidth_bytes |
cached and uncached bandwidth sent from an edge-location | gauge |
cloudflare_pop_http_responses_sent |
breakdown of requests per HTTP code | gauge |
cloudflare_pop_threats_seen |
number of threats identified received in at this location | gauge |
cloudflare_pop_threat_types |
types of threats seen | gauge |
cloudflare_pop_threat_countries |
countries causing threats | gauge |
cloudflare_dns_record_queries |
DNS record queries per edge-location | gauge |
cloudflare_waf_uri_hits |
WAF-rule hits at PoP location per uri | gauge |
cloudflare_waf_rules |
WAF-rules in the system and a hit count | gauge |
Random scrape result:
# HELP cloudflare_pop_http_responses_sent Breakdown per HTTP response code.
# TYPE cloudflare_pop_http_responses_sent gauge
cloudflare_pop_http_responses_sent{colo_id="BRU",http_status="200",zone="example.com"} 25.0
cloudflare_pop_http_responses_sent{colo_id="BRU",http_status="302",zone="example.com"} 1.0
cloudflare_pop_http_responses_sent{colo_id="BRU",http_status="204",zone="example.com"} 2.0
# HELP cloudflare_pop_threat_countries Threat breakdown per threat country.
# TYPE cloudflare_pop_threat_countries gauge
# HELP cloudflare_pop_threat_types Threat breakdown per threat type.
# TYPE cloudflare_pop_threat_types gauge
# HELP cloudflare_pop_threats_seen Threats identified.
# TYPE cloudflare_pop_threats_seen gauge
cloudflare_pop_threats_seen{colo_id="BRU",zone="example.com"} 0.0
# HELP cloudflare_pop_bandwidth_bytes Bandwidth sent from this PoP location.
# TYPE cloudflare_pop_bandwidth_bytes gauge
cloudflare_pop_bandwidth_bytes{colo_id="BRU",type="cached",zone="example.com"} 404362.0
cloudflare_pop_bandwidth_bytes{colo_id="BRU",type="uncached",zone="example.com"} 68411.0
# HELP cloudflare_pop_received_requests Requests received at this PoP location.
# TYPE cloudflare_pop_received_requests gauge
cloudflare_pop_received_requests{colo_id="BRU",type="cached",zone="example.com"} 10.0
cloudflare_pop_received_requests{colo_id="BRU",type="uncached",zone="example.com"} 18.0
# HELP cloudflare_dns_record_queries DNS queries per record at PoP location.
# TYPE cloudflare_dns_record_queries gauge
cloudflare_dns_record_queries{colo_id="SOF",query_response="NXDOMAIN",record_name="qlgijqgzsd.example.com",record_type="A",zone="example.com"} 1.0
cloudflare_dns_record_queries{colo_id="LAX",query_response="NOERROR",record_name="www.example.com",record_type="A",zone="example.com"} 5.0
# HELP cloudflare_waf_rules WAF-rules in the system and a hit count.
# TYPE cloudflare_waf_rules counter
cloudflare_waf_rules{rule_id="unknown",rule_message="internal"} 9.0
# HELP cloudflare_waf_uri_hits WAF-rule hits at PoP location per uri.
# TYPE cloudflare_waf_uri_hits gauge
cloudflare_waf_uri_hits{action="block",attacking_country="T1",colo_id="OSL",host="www.example.com",method="GET",protocol="HTTP/1.1",rule_id="unknown",uri="/"} 9.0Cloudflare consideres the WAF analytics API experimental. The exporter currently supports dropping incoming T1 traffic (attacks) from the metrics, this can be enabled by setting the following in your environment: SCRAPER_SKIP_T1=true
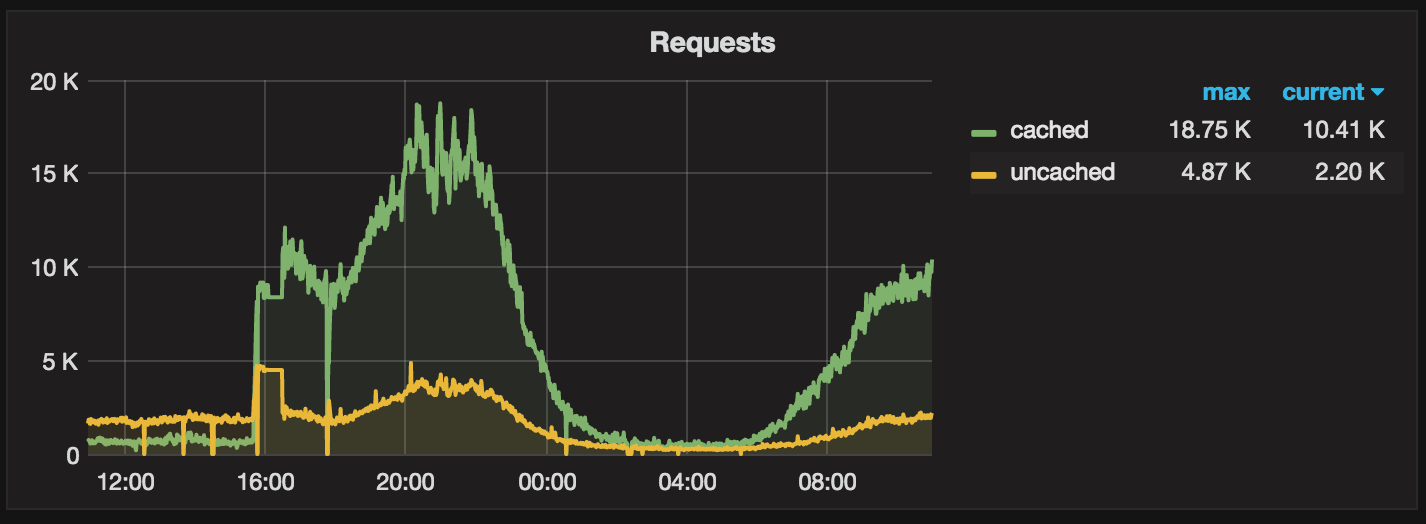
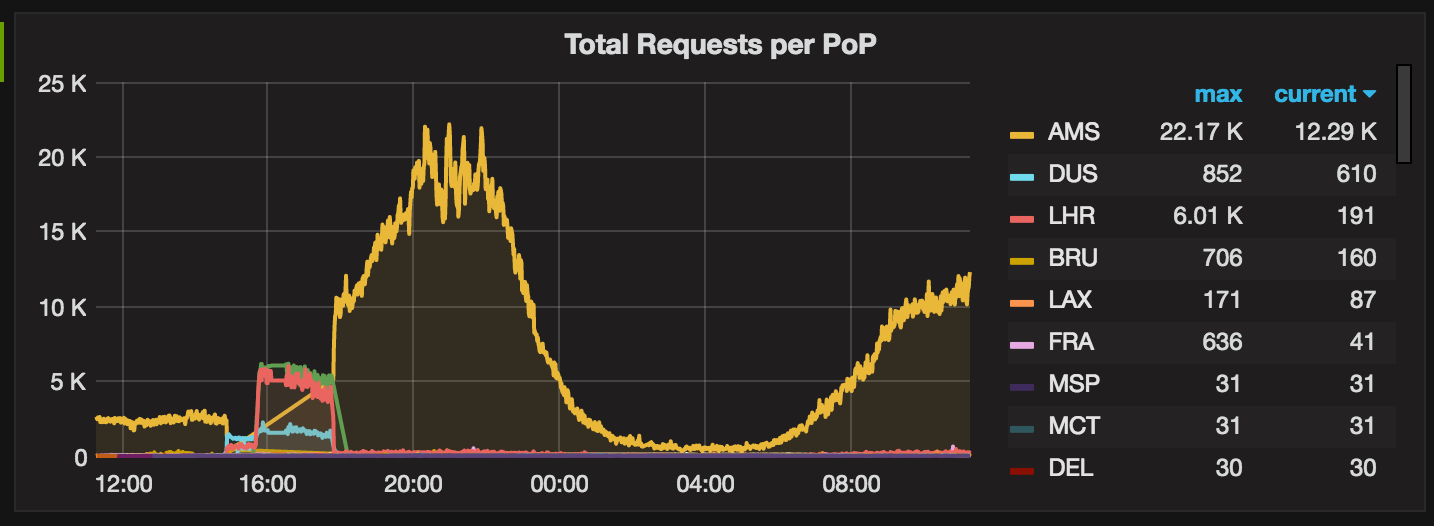
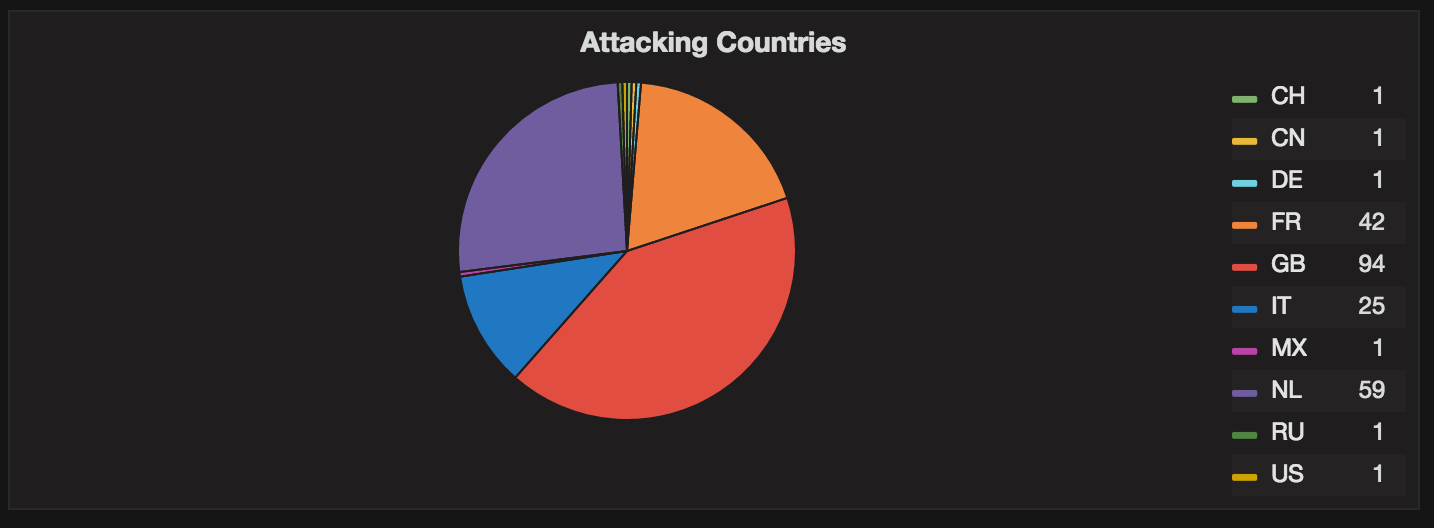
A sample Grafana dashboard is included to visualize the information.
Overview of requests, cached and uncached:

Overview of requests served per Cloudflare network point-of-presence:

Overview of actual countries that cause threats:

- Implement a way to store datapoints in Prometheus using timestamps received from Cloudflare. This should remove the delay as we currently have it.