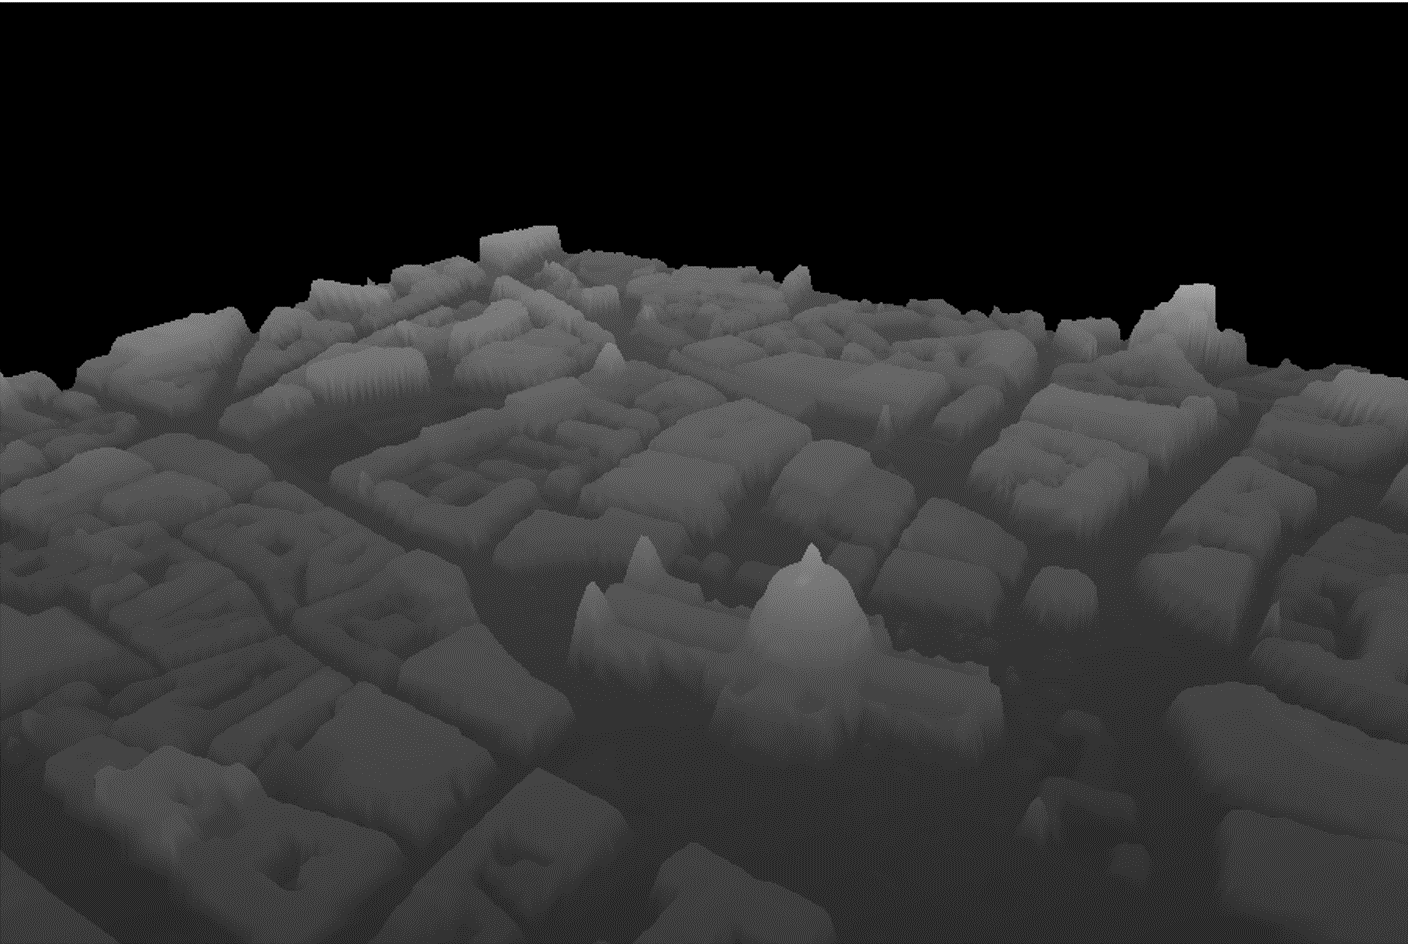
LIDAR data from DEFRA
A blog post describing this work: http://www.ianhopkinson.org.uk/2015/10/analysing-lidar-data-for-the-uk/
Usage
process.py {OS_grid_cell} {friendly_name} will display a window showing the data from a LIDAR map tile.
OS_grid_cell is, for example, SJ46 for Chester. The {friendly_name} will later be used in the display of menus and is optional.
The data is assumed to be in a zip file with name of the form:
LIDAR-DSM-2M-{OS_grid_cell}.zip
These data must be downloaded manually from:
http://environment.data.gov.uk/ds/survey#/download
So far I've successfully used the 2m resolution Terrain and Surface files.
Run ./process.py, and after a shortish pause (<1 minute) you should see a greyscale
image of your map tile with height encoded as shade (black = lowest, white = highest). This
image is written at full resolution to the images/ directory with the name {OS_grid_cell}.png.
Nominally there are 100 subtiles to a set but some are missing and appear as black squares, some locations have NODATA, these also appear black in the image.
This assumes you have numpy and matplotlib libraries installed.
There are minimal tests which can be run by doing nosetests, assuming you have nosetests installed
There are currently two experimental HTML/Javascript visualisations. To run them, run the minimal webserver in Python 3:
python -m http.server 8888 &
And then navigate to localhost:8888 for a leaflet.js map overlay visualisation, the available images and their
bounding boxes will be picked up from the data_dict.json file which is updated when process.py is run.
Navigate to localhost:8888/surface.html to see a whizzy 3D surface rendering, just edit in the
appropriate image file name to surface.html. (I've been making 512x512 pixel crops of the full sized images using Paint .NET.)
Holding left-mouse (or A) and moving the mouse rotates the view,
right-mouse-button (or D) pans the view, middle-mouse-button (or S) zooms the view.
TODO
- For 25cm and 50cm resolution data don't render a whole 10kmx10km tile - render individual tiles or make a tight bounding box?
- Trying to process 50cm dataset we get a memory low error, and then a MemoryError on trying to imshow, 20000x20000 pixel png successfully created though
- Trying to process a 25cm dataset we get off-by-one errors in yoffset (and the image is too large for imshow)
- Fix mismatch problem with the leaflet.js visualisation, could this be the problem:
Or it might be that OS uses transverse Mercator and OSM uses spherical Mercator projection
- Autodownload of data
- Select in leaflet.js and go to surface view, this looks handy:
https://github.com/heyman/leaflet-areaselect/
- Processing spinner for surface.html initial start
- Beautification with Bootstrap
Data
Terrain data is an estimation of underlying terrain, surface data is the actual measurement including buildings, vehicles and vegetation.
The data lives here:
http://environment.data.gov.uk/ds/survey#/download
http://environment.data.gov.uk/ds/survey#/download?grid=SJ36
There's JSON metadata for each grid:
http://www.geostore.com/environment-agency/rest/product/OS_GB_10KM/SJ46
The id in the JSON tells you where you can download the zip file, e.g.:
http://www.geostore.com/environment-agency/rest/product/download/6129
References
Handy collect of links
http://mapgubbins.tumblr.com/post/131424021480/open-data-release-of-aerial-lidar-data-for
This tool converts OS map reference x,y to lat, lng (and shows them on a map)
http://gridreferencefinder.com/
Code for converting OS x,y to lat,lng is by Hannah Fry, described here:
Get tile origin from OS National Grid reference:
http://digimap.edina.ac.uk/webhelp/os/gazetteer_plus/grid_ref_conversion.htm
We could make an image overlay using leafet.js:
http://leafletjs.com/reference.html#imageoverlay
https://www.mapbox.com/mapbox.js/example/v1.0.0/imageoverlay-georeferenced/
Rendering a surface in three.js
http://www.smartjava.org/content/threejs-render-real-world-terrain-heightmap-using-open-data
Adding a trackball interactive control to three.js
http://stackoverflow.com/questions/18347256/trackballcontrols-in-three-js
Opacity controller is lifted from a Mapbox demo:
