A quick tree evaluation of the Heart Diseas Cleveland dataset from Kaggle.
import numpy as np
import pandas as pd

from sklearn.metrics import accuracy_score
from sklearn.model_selection import train_test_split
from sklearn import tree

import matplotlib.pyplot as pyplot
pyplot.rcParams['figure.dpi'] = 150
pyplot.rcParams['savefig.dpi'] = 150
The ultimate aim is to predict whether a patient has heart disease or not. First we load the available data, which contains the information for each patient, including the coding whether the have heart desease (condition == 1) or not (condition == 0).
heart_cleveland = pd.read_csv('heart_cleveland_upload.csv')
print(heart_cleveland.head())
print(heart_cleveland.shape)
age sex cp trestbps chol fbs restecg thalach exang oldpeak slope \
0 69 1 0 160 234 1 2 131 0 0.1 1
1 69 0 0 140 239 0 0 151 0 1.8 0
2 66 0 0 150 226 0 0 114 0 2.6 2
3 65 1 0 138 282 1 2 174 0 1.4 1
4 64 1 0 110 211 0 2 144 1 1.8 1
ca thal condition
0 1 0 0
1 2 0 0
2 0 0 0
3 1 0 1
4 0 0 0
(297, 14)
Next we extract the X (predictors) and Y (condition) values and split them into test and train sets.
X = heart_cleveland.drop(columns=['condition'])
Y = heart_cleveland.loc[:, 'condition']

train_x, test_x, train_y, test_y = train_test_split(X, Y, test_size=.2, random_state=42)

print(train_x.shape)
print(test_x.shape)
print(train_y.shape)
print(test_y.shape)
(237, 13)
(60, 13)
(237,)
(60,)
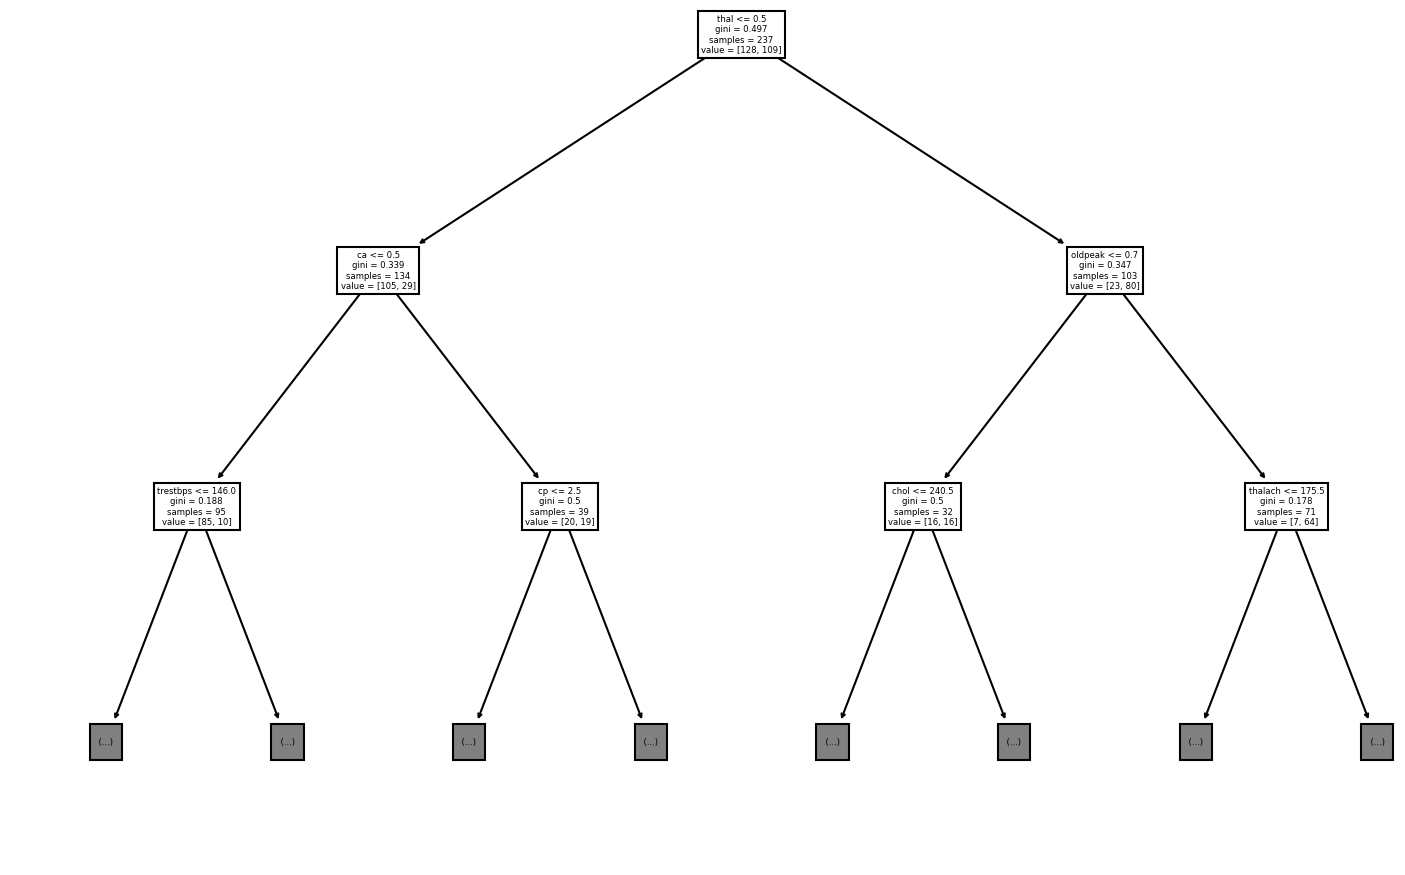
To start to identify the most powerful predictors we build a basic classification tree.
accuracies = {}
best_accuracy = 0

for min_sample_split in range(train_y.size, 2, -1):
    heart_tree = tree.DecisionTreeClassifier(max_leaf_nodes=min_sample_split)
    heart_tree = heart_tree.fit(train_x, train_y)
    pred_y = heart_tree.predict(test_x)
    try:
        accuracies[accuracy_score(test_y, pred_y)].append(min_sample_split)
    except KeyError:
        accuracies[accuracy_score(test_y, pred_y)] = [min_sample_split]

    if accuracy_score(test_y, pred_y) >= best_accuracy:
        best_accuracy = accuracy_score(test_y, pred_y)
        best_model = heart_tree

print("Most accurate model has a maximum of ",
      best_model.get_n_leaves(), " leaf nodes.")

best_pred_y = best_model.predict(test_x)
print("The accurace of the model is", accuracy_score(test_y, best_pred_y))

tree.plot_tree(best_model, max_depth=2, feature_names=train_x.columns)
Most accurate model has a maximum of 39 leaf nodes.
The accurace of the model is 0.7666666666666667
[Text(348.75, 396.375, 'thal <= 0.5\ngini = 0.497\nsamples = 237\nvalue = [128, 109]'),
Text(174.375, 283.125, 'ca <= 0.5\ngini = 0.339\nsamples = 134\nvalue = [105, 29]'),
Text(87.1875, 169.875, 'trestbps <= 146.0\ngini = 0.188\nsamples = 95\nvalue = [85, 10]'),
Text(43.59375, 56.625, '\n (...) \n'),
Text(130.78125, 56.625, '\n (...) \n'),
Text(261.5625, 169.875, 'cp <= 2.5\ngini = 0.5\nsamples = 39\nvalue = [20, 19]'),
Text(217.96875, 56.625, '\n (...) \n'),
Text(305.15625, 56.625, '\n (...) \n'),
Text(523.125, 283.125, 'oldpeak <= 0.7\ngini = 0.347\nsamples = 103\nvalue = [23, 80]'),
Text(435.9375, 169.875, 'chol <= 240.5\ngini = 0.5\nsamples = 32\nvalue = [16, 16]'),
Text(392.34375, 56.625, '\n (...) \n'),
Text(479.53125, 56.625, '\n (...) \n'),
Text(610.3125, 169.875, 'thalach <= 175.5\ngini = 0.178\nsamples = 71\nvalue = [7, 64]'),
Text(566.71875, 56.625, '\n (...) \n'),
Text(653.90625, 56.625, '\n (...) \n')]
