Refer to: https://docs.python.org/3/library/pdb.html
a python module
- so can be executed by
python -m pdb <source_file>
- python -m pdb <source_file>
- actually call
Pdb()._runscript(source_file)
- actually call
- insert by code:
import pdb pdb.set_trace() - debug a module/function
 [willchen@fdev060101 decorator]$ ipython
 Python 2.7.12 |Anaconda 4.1.1 (64-bit)| (default, Jul  2 2016, 17:42:40)
 Type "copyright", "credits" or "license" for more information.

 IPython 4.2.0 -- An enhanced Interactive Python.
 ?         -> Introduction and overview of IPython's features.
 %quickref -> Quick reference.
 help      -> Python's own help system.
 object?   -> Details about 'object', use 'object??' for extra details.

 In [1]: import test
 In [2]: import pdb
 In [4]: pdb.run('test.my_print("abc")')
 > <string>(1)<module>()->None
 (Pdb) s
 --Call--
 > /n/home/dev/willchen/study/py/decorator/test.py(4)my_print()
 -> def my_print(msg):
 (Pdb) p msg
 'abc'
 (Pdb) n
 > /n/home/dev/willchen/study/py/decorator/test.py(5)my_print()
 -> for i in range(3):
 (Pdb) n
 > /n/home/dev/willchen/study/py/decorator/test.py(6)my_print()
 -> print(msg)
-
n(ext)
-
s(tep)
-
c(ont(inue)): continue
-
b(reak) [([filename:]lineno | function) [, condition]]
With a lineno argument, set a break there in the current file. With a function argument, set a break at the first executable statement within that function. The line number may be prefixed with a filename and a colon, to specify a breakpoint in another file (probably one that hasn’t been loaded yet). The file is searched on sys.path. Note that each breakpoint is assigned a number to which all the other breakpoint commands refer.
If a second argument is present, it is an expression which must evaluate to true before the breakpoint is honored.
Without argument, list all breaks, including for each breakpoint, the number of times that breakpoint has been hit, the current ignore count, and the associated condition if any
-
j(ump) lineno:
Set the next line that will be executed. Only available in the bottom-most frame. This lets you jump back and execute code again, or jump forward to skip code that you don’t want to run.
It should be noted that not all jumps are allowed – for instance it is not possible to jump into the middle of a for loop or out of a finally clause
-
a(rgs): print function arguments
-
tbreak [([filename:]lineno | function) [, condition]]
Temporary breakpoint, which is removed automatically when it is first hit. The arguments are the same as for break.
-
cl(ear) [filename:lineno | bpnumber]: remove specified breakpoint
-
unt(il) [line number]: run until reach specified line(version3.2)
-
w(here): Print a stack trace
-
u(p) [count]: Move the current frame count (default one) levels up in the stack trace (to an older frame).
-
d(own) [count]: Move the current frame count (default one) levels down in the stack trace (to a newer frame).
-
commands [bpnumber] Specify a list of commands for breakpoint number bpnumber. The commands themselves appear on the following lines. Type a line containing just end to terminate the commands.
-
...
ipdb exports functions to access the IPython debugger, which features tab completion, syntax highlighting, better tracebacks, better introspection with the same interface as the pdb module.
- set context
import ipdb
ipdb.set_trace(context=5) # default is 3
(py27) C:\Users\willchen\pwc\codes\rnn_ml_lh>python test.py
> c:\users\willchen\pwc\codes\rnn_ml_lh\test.py(5)<module>()
      3 ipdb.set_trace(context=5)
      4
----> 5 class Book():
      6     @property
      7     def page(self):
ipdb>
- set condition to stop
import ipdb
ipdb.set_trace(context=5, cond=get_diff() > 1e-6)
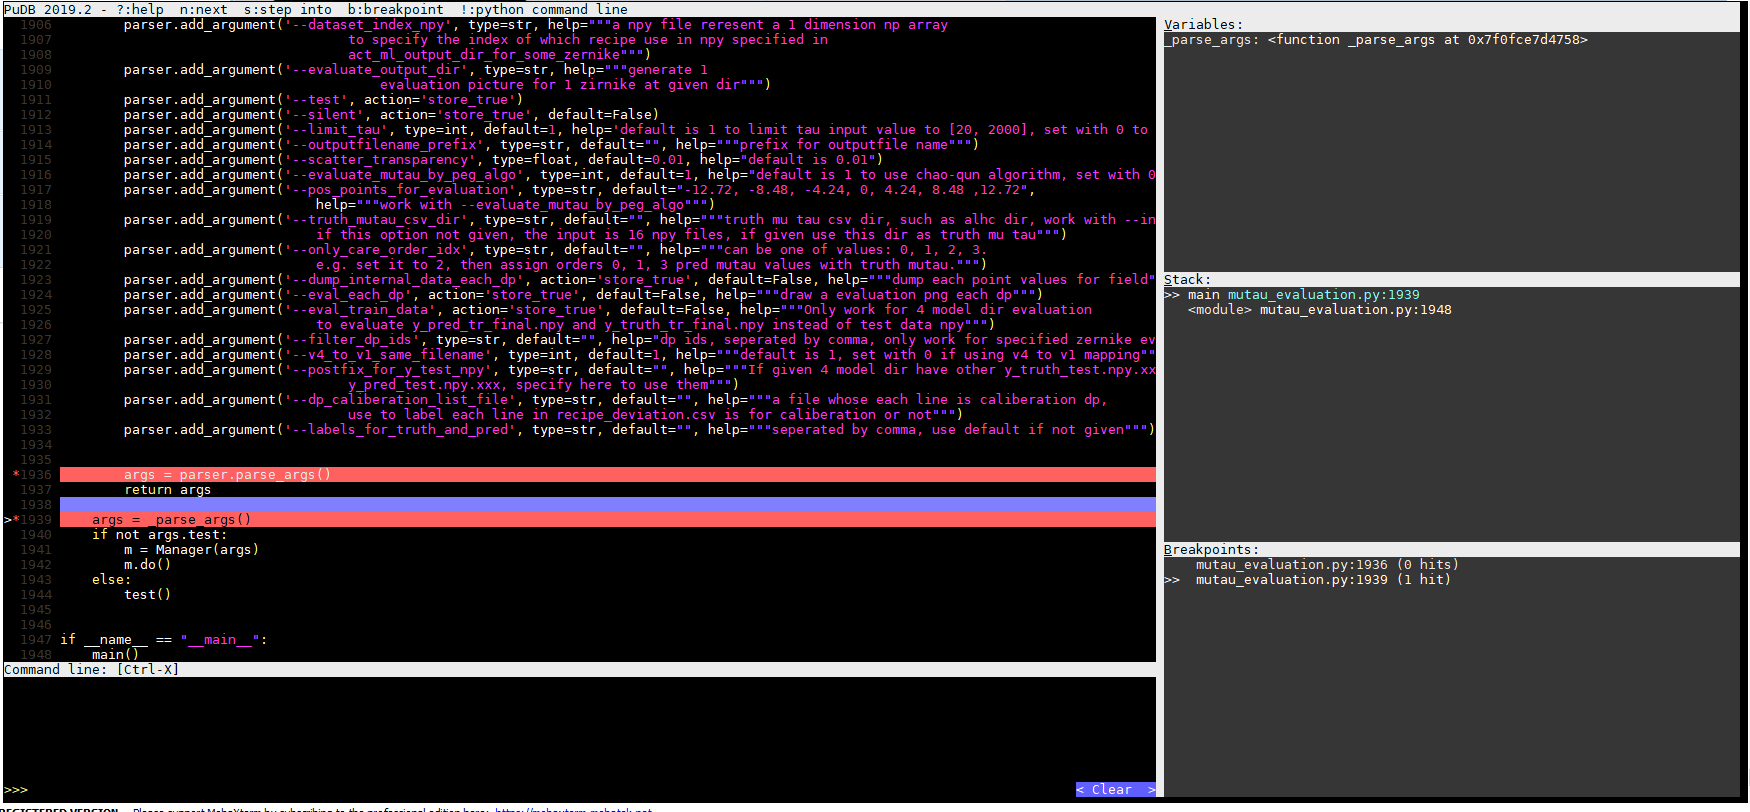
Its goal is to provide all the niceties of modern GUI-based debuggers in a more lightweight and keyboard-friendly package. PuDB allows you to debug code right where you write and test it–in a terminal. If you’ve worked with the excellent (but nowadays ancient) DOS-based Turbo Pascal or C tools, PuDB’s UI might look familiar.
willchen@twdevxxx:~/pwc/ml_lens_model_train/evaluate$ env PYTHONPATH=/home/willchen/usr/py/site-packages/ python -m pudb mutau_evaluation.py
[willchen@fdevxxx:evaluate]$ env PYTHONPATH=/nfs/DEV/PWCGUI/willchen/usr/py/site-packages/ python -m pudb mutau_evaluation.py
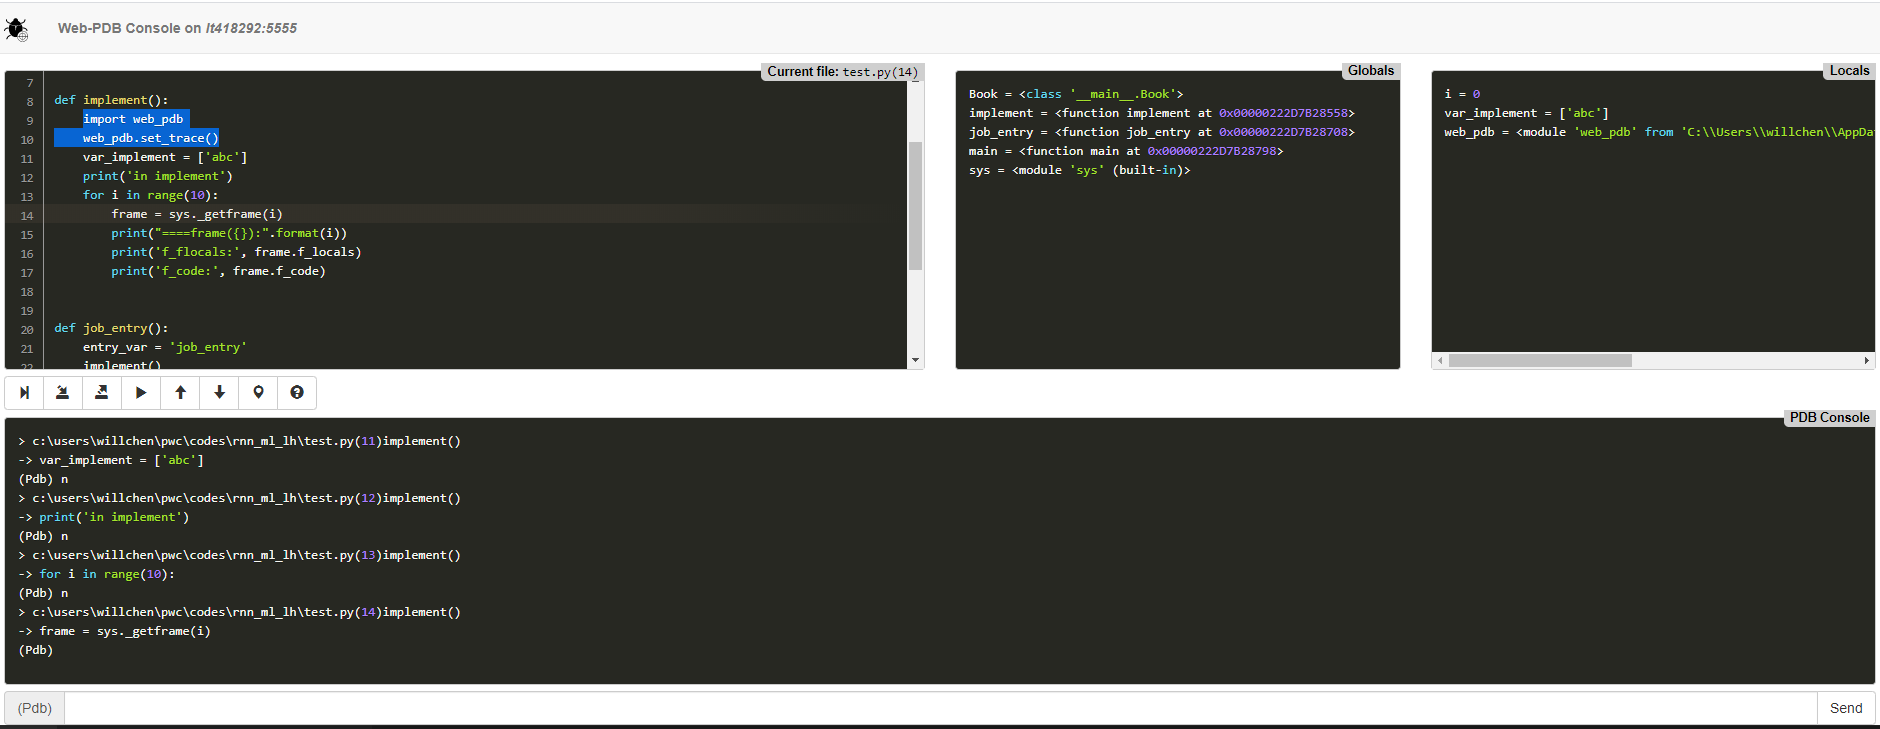
Web-PDB is a web-interface for Python's built-in PDB debugger. It allows to debug Python scripts remotely in a web-browser.
- insert trigger code
import web_pdb
web_pdb.set_trace()
from https://pypi.org/project/PySnooper/
import pysnooper

@pysnooper.snoop()
def number_to_bits(number):
    if number:
        bits = []
        while number:
            number, remainder = divmod(number, 2)
            bits.insert(0, remainder)
        return bits
    else:
        return [0]

number_to_bits(6)
Then the output to stderr is:
Source path:... /my_code/foo.py
Starting var:.. number = 6
15:29:11.327032 call         4 def number_to_bits(number):
15:29:11.327032 line         5     if number:
15:29:11.327032 line         6         bits = []
New var:....... bits = []
15:29:11.327032 line         7         while number:
15:29:11.327032 line         8             number, remainder = divmod(number, 2)
New var:....... remainder = 0
Modified var:.. number = 3
15:29:11.327032 line         9             bits.insert(0, remainder)
Modified var:.. bits = [0]
15:29:11.327032 line         7         while number:
15:29:11.327032 line         8             number, remainder = divmod(number, 2)
Modified var:.. number = 1
Modified var:.. remainder = 1
15:29:11.327032 line         9             bits.insert(0, remainder)
Modified var:.. bits = [1, 0]
15:29:11.327032 line         7         while number:
15:29:11.327032 line         8             number, remainder = divmod(number, 2)
Modified var:.. number = 0
15:29:11.327032 line         9             bits.insert(0, remainder)
Modified var:.. bits = [1, 1, 0]
15:29:11.327032 line         7         while number:
15:29:11.327032 line        10         return bits
15:29:11.327032 return      10         return bits
Return value:.. [1, 1, 0]
Elapsed time: 00:00:00.000001
import pysnooper
import random

def foo():
    lst = []
    for i in range(10):
        lst.append(random.randrange(1, 1000))

    with pysnooper.snoop():
        lower = min(lst)
        upper = max(lst)
        mid = (lower + upper) / 2
        print(lower, mid, upper)

foo()
- Save to file instead of stderr
@pysnooper.snoop('/my/log/file.log')
- See values of some expressions that aren't local variables:
@pysnooper.snoop(watch=('foo.bar', 'self.x["whatever"]'))
- pdb
- officially support
- ipdb
- more functions then pdb
- pudb
- lightweight GUI-debugger
- see codes, stack, breakpoints and variables realtime
- execute commands like pdb
- web-pdb
- need insert codes
- pysnooper
- see each lines' condition with one running
- debug when interpreter exit(codes from swig)

