English | 简体中文


Augmented Analytics tool. Help you automate explore data and recommend visualization based on human visual perception.
Rath can recommend high-dimensional visualization which contains deep and complex patterns.
- Try Latest version !! demo(latest)
- Try Stable version demo(stable)
- Youtube Video Demo
- Bilibili Video Demo
Rath helps you extract insights from datasource automatically and generate interactive visualizations with interesting findings. Rath can auto generate high dimensional visualization contains complex patterns while most other auto-EDA tools only providing simple low dimensional charts with basic statistics pattern. Its means you can use Rath to explore the data to a deep level and find more insights.
Rath design an algorithm recommending visualization with lowest perception error by human eyes, which means you can read the info in visualization much accurate[1]. The origin idea is mentioned in APT, 1987 by Mackinlay[2]. It suggests using visual channel with lower perception error to encode more important fields. However, 'the importance of field' usually is hard to measure. Works like data voyager (compassQL)[3] suppose the fields chosen earlier by user are more important, which means it cannot be used in an automated process where exists no chosen order.
Rath compute how much extra view entropy(similar thoughts like entropy, but not exactly the same) a field will bring to a visualization, and use lower perception error visual channel to encode field bring more entropy to the visualization view.
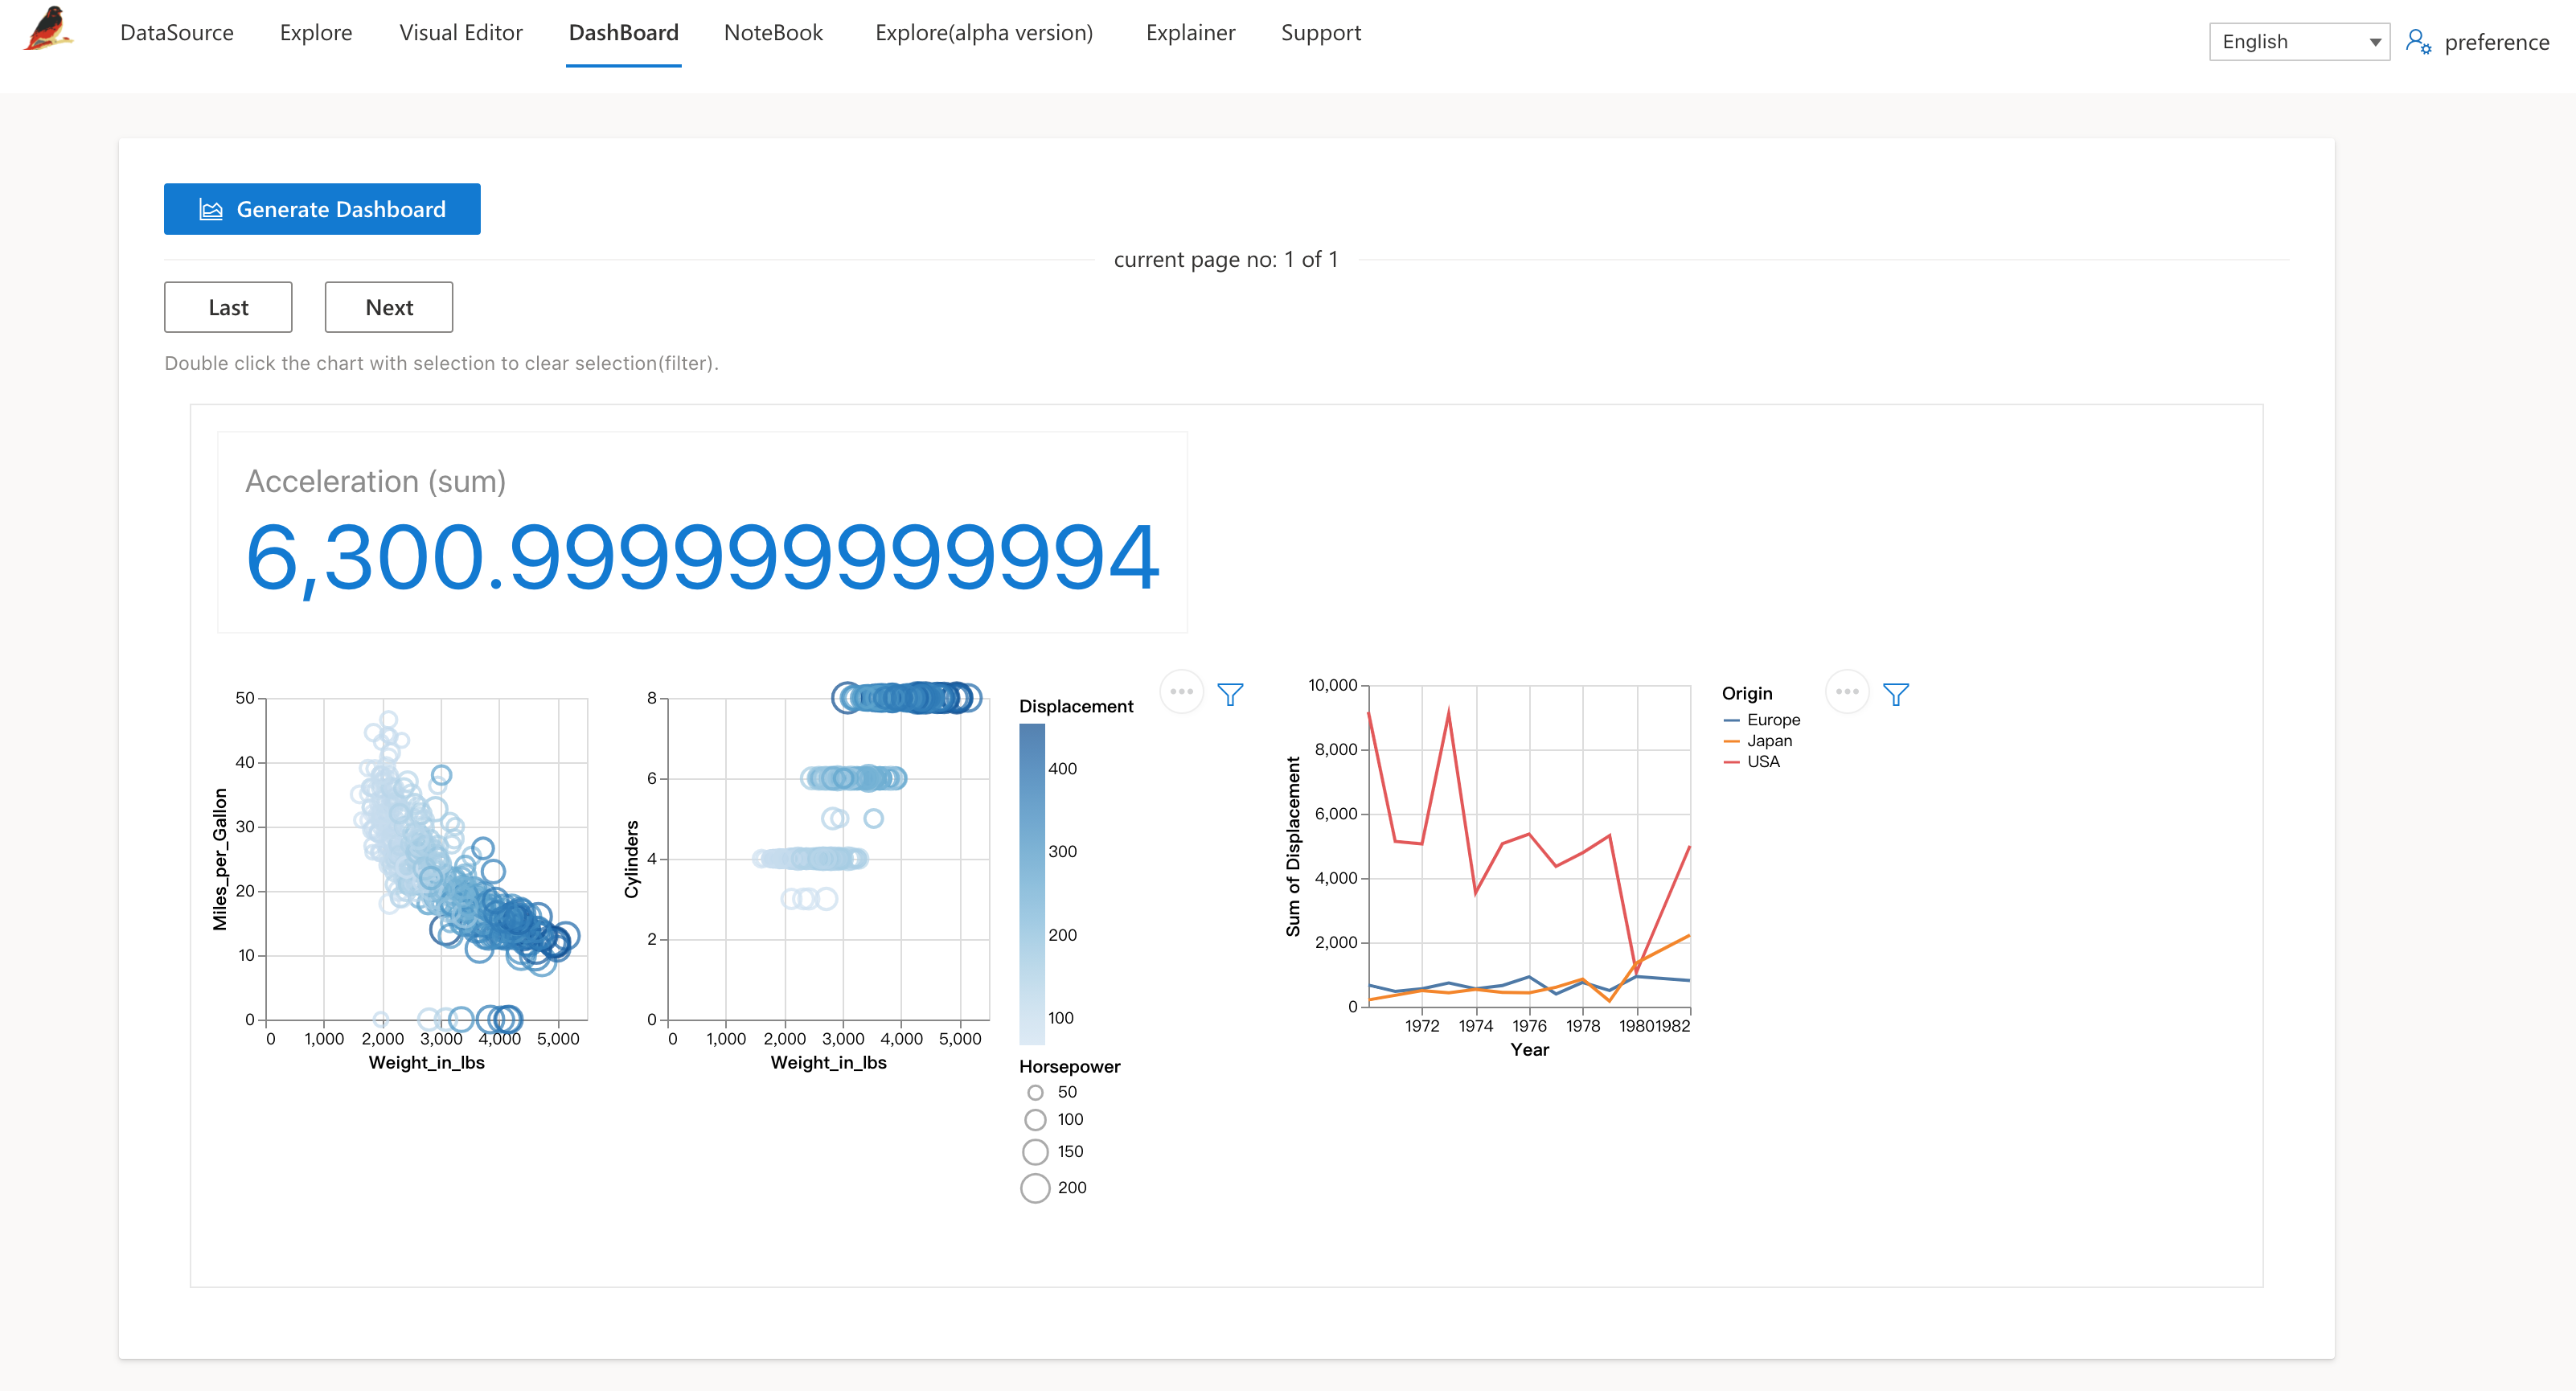
Rath can also automate generate best interactive logic of visualizations in a dashboard. It builds a relation graph of visualization set and choose a sub graph which has max sum of edge score(represent relation). It make the selection-filter interaction represents more meaningful correlation or dependency between fields in different visualization.
Here are main parts in Rath,
DataSource board is for data uploading, sampling(currently support stream data, which means there is no limit of the size of file you uploaded), cleaning and defining fields type(dimensions, measures). In visual insights, we regard dimensions as independent variable or feature and measures as dependent variable or target.
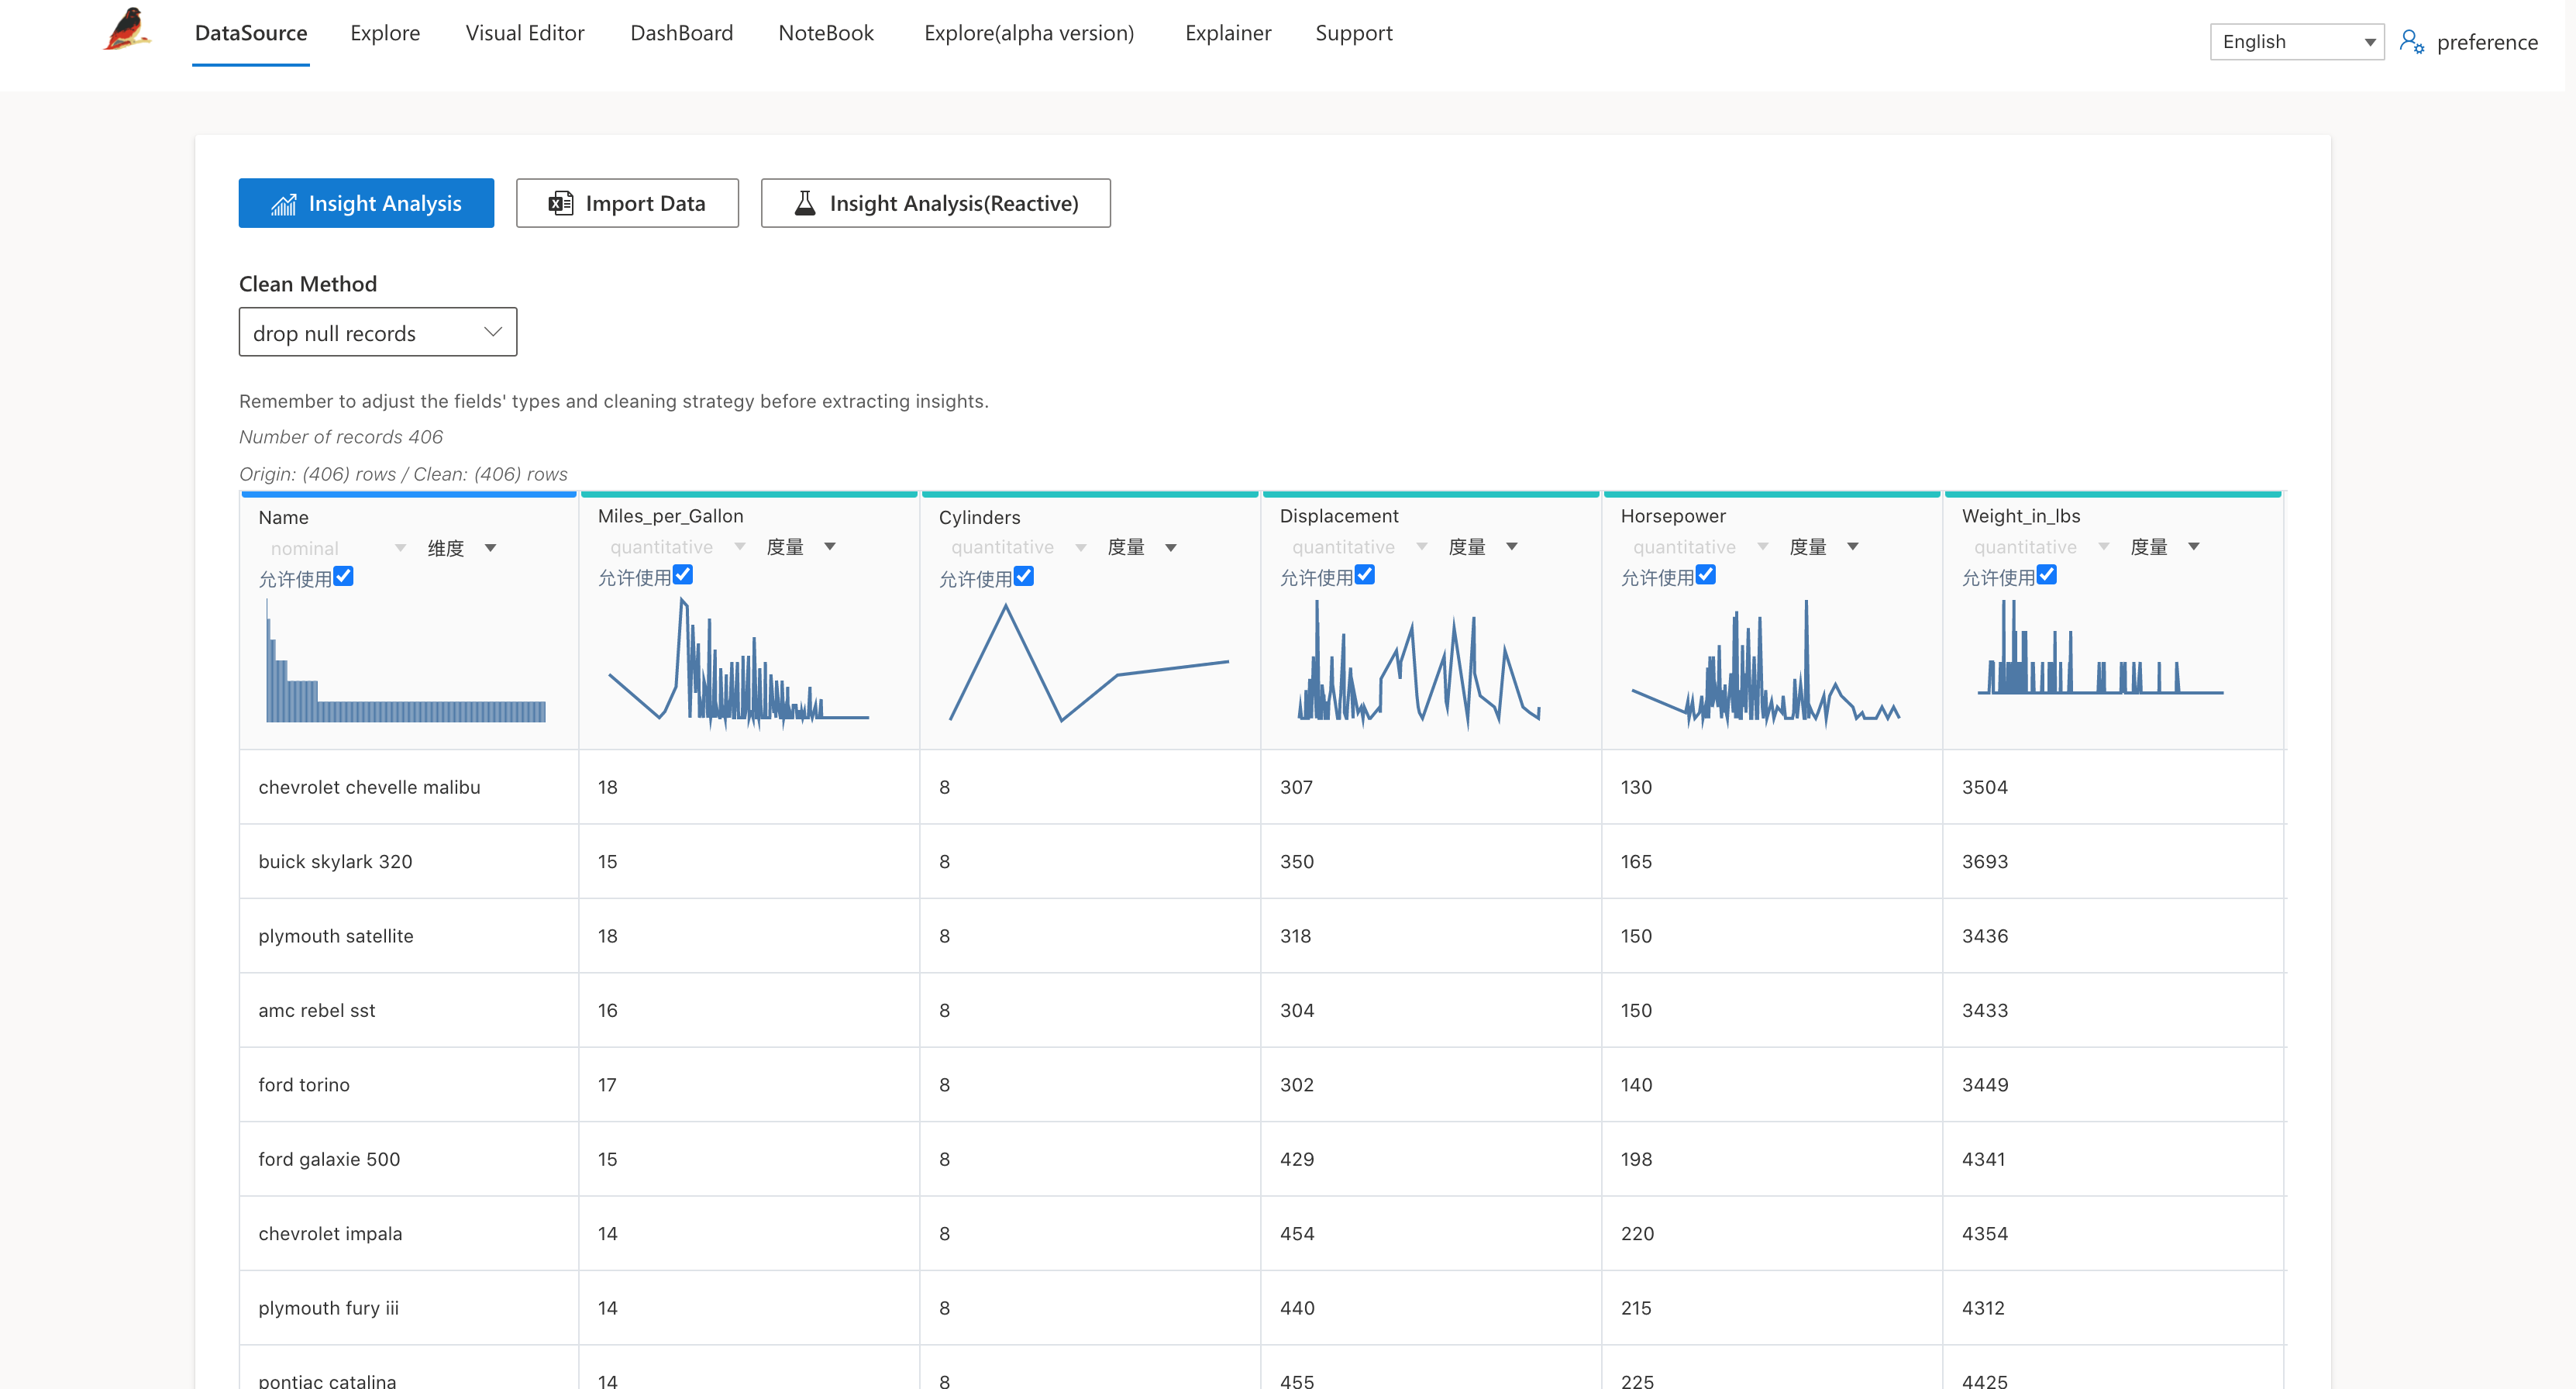
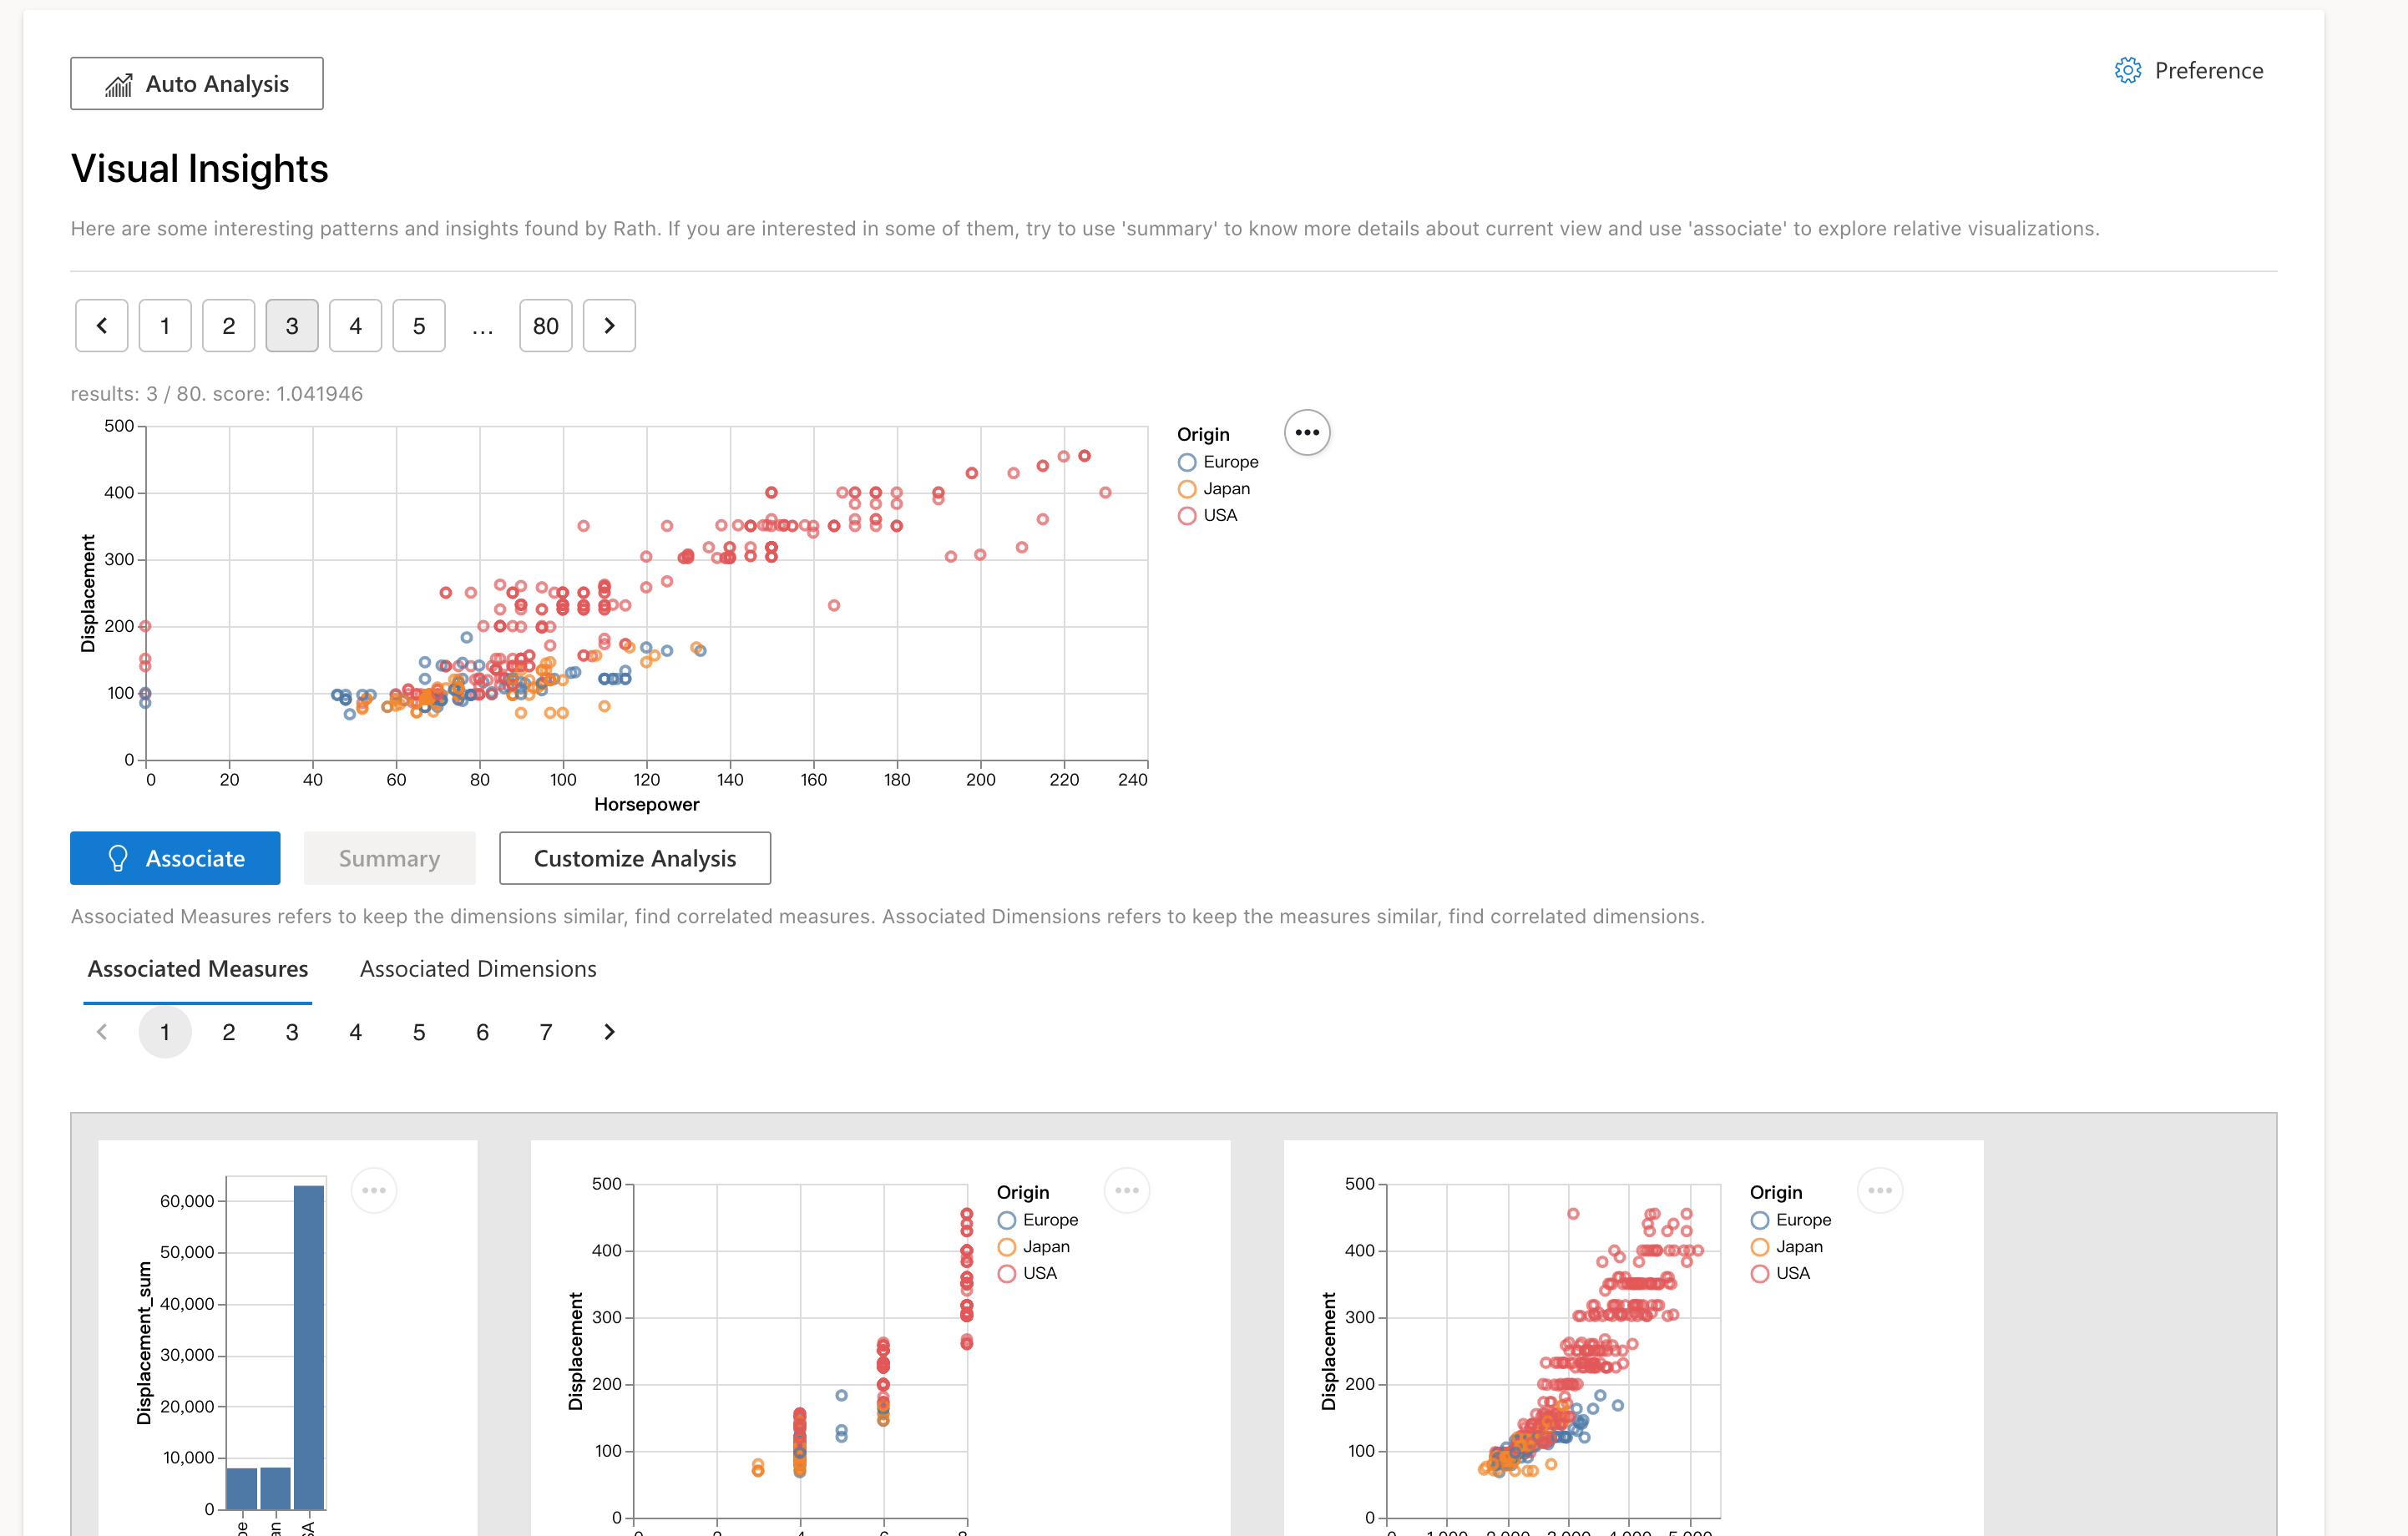
Rath automate scan your datasource and find interesting deep patterns which will be displayed in Gallery / Explore segment. In Gallery, you can find interesting visualization and use association feature to find more related visualization. You can also search specific info in gallery. There are some settings here to adjust some of the visual elements in the chart.
Graphic Walker is a lite tableau style visual analysis interface. It is used for cases when users have specific analytic target or user want to analysis further result based on the recommended results by Rath's auto insights.
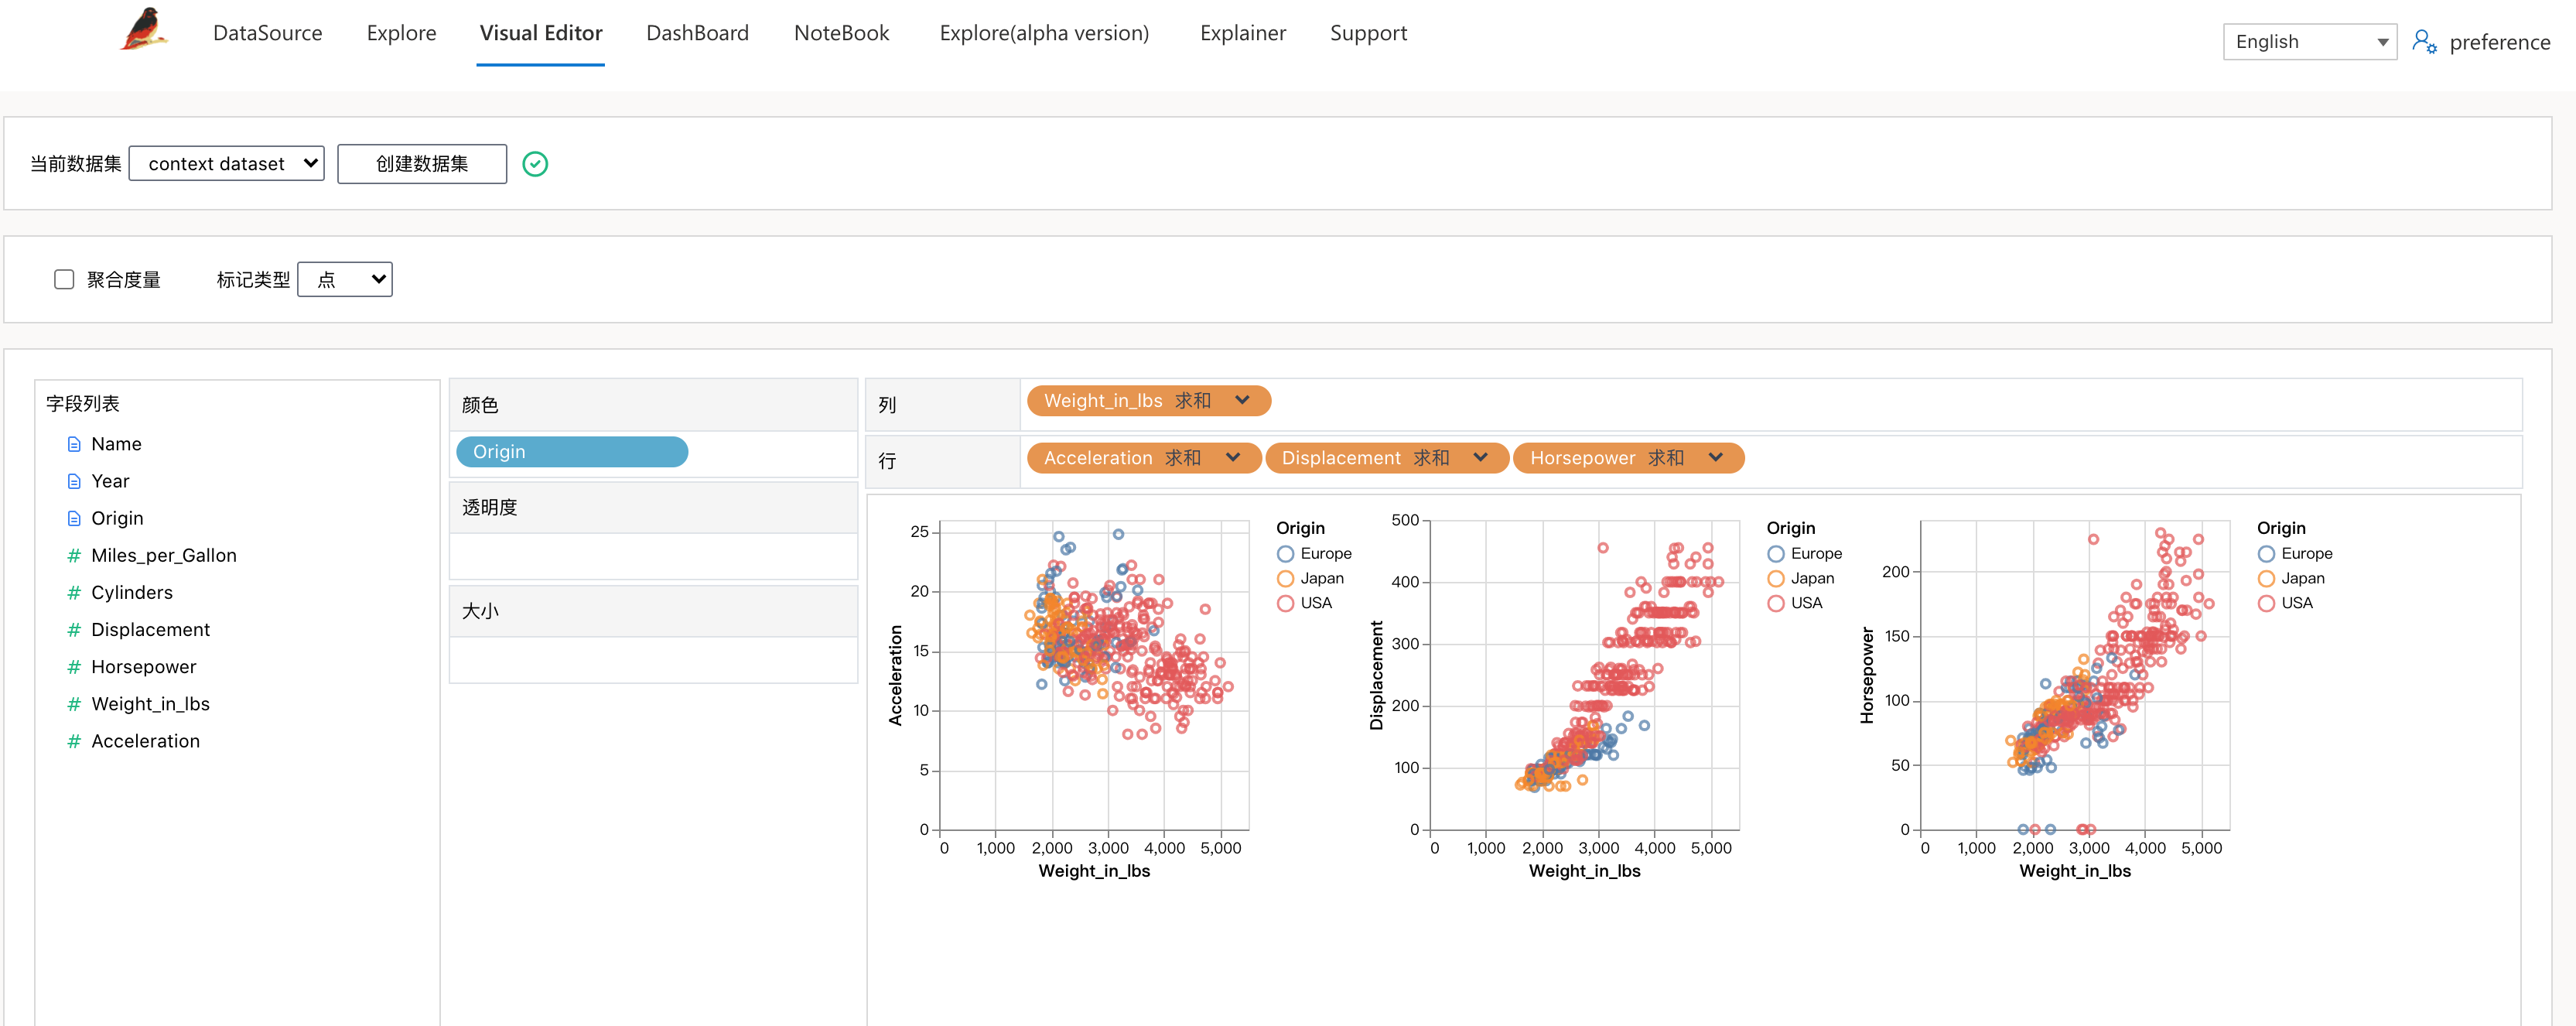
Graphic Walker is an independent embedding module. You can use it independently in your own app. See more details in packages/graphic-walker/README.md
yarn add @kanaries/graphic-walker
# or

npm i --save @kanaries/graphic-walkerGenerate interactive dashboards for your. Rath will figure out sets of visualizations of which contents are connected to each other and can be used to analysis a specific problem.
Notebook is a board for user to know what happened in the automatic analysis process and how rath uses visual-insights. It shows how decisions are made by the application and provide interactive interface to adjust some of the parameters and operators used by the algorithm.
Explainer uses several insight discovery algorithm to detect what is the specific insight type is shown in a visualization recommended. Explainer is an extension of B. Tang 's Top K insight paper[4].
You can also use Graphic Walker as a lite tableau style analysis app independently. It can be used as an independent app or an embedding module.
more details can be found in README.md in graphic-walker folder.
Details of the test result can be accessed here
Rath now runs all the computation tasks on webworker. If you are interested in a server version, check the older version or contact us.
(dev)
yarn install
# under project root dir
yarn workspace graphic-walker build

yarn workspace frontend start

# localhost:3000
production mode
yarn install

yarn workspace graphic-walker build

yarn workspace frontend build

# server:8000
only use the algorithm package. (/packages/visual-insights)

npm i visual-insights --save- Tutorial: Using Rath to find deep insight in your data
- visual insight api: visual-insights
- doc for reuseable hooks: todos
Rath is insipired by several excellent works below:
- [1] Cleveland, W., & McGill, R. (1984). Graphical Perception: Theory, Experimentation, and Application to the Development of Graphical Methods. Journal of the American Statistical Association, 79(387), 531-554. doi:10.2307/2288400
- [2] Mackinlay, Jock D. Automatic design of graphical presentations. Stanford Univ., CA (USA), 1987.
- [3] Wongsuphasawat, Kanit, et al. "Voyager 2: Augmenting visual analysis with partial view specifications." Proceedings of the 2017 CHI Conference on Human Factors in Computing Systems. ACM, 2017.
- [4] B. Tang et al, "Extracting top-K insights from multi-dimensional data," in 2017, . DOI: 10.1145/3035918.3035922.
- [5] Vega-Lite: A Grammar of Interactive Graphics. Arvind Satyanarayan, Dominik Moritz, Kanit Wongsuphasawat, Jeffrey Heer. IEEE Trans. Visualization & Comp. Graphics (Proc. InfoVis), 2017
Rath is an automated data analysis and visualization tool (auto-EDA).
Copyright (C) 2019-now Observed Observer(Hao Chen)
This program is free software: you can redistribute it and/or modify it under the terms of the GNU Affero General Public License as published by the Free Software Foundation, either version 3 of the License, or (at your option) any later version.
This program is distributed in the hope that it will be useful, but WITHOUT ANY WARRANTY; without even the implied warranty of MERCHANTABILITY or FITNESS FOR A PARTICULAR PURPOSE. See the GNU Affero General Public License for more details.
You should have received a copy of the GNU Affero General Public License along with this program. If not, see https://www.gnu.org/licenses/.