The scope of this repo is twofold
- Create a DB containing information about flights in 2019
- Use these data to perform an analysis of the delayed departures in San Francisco.
Data are obtained from the Bureau of Transportation Statistics. This website allows to download data for a specific year and month, and to select the required information.
We focus on data from 2019 and download the complete set of info for each month.
Each month corresponds to a .csv file that is stored in the folder ./data/all with a name corresponding to the month. E.g. ./data/all/5.csv corresponds to May 2019.
In addition to the data files, there are six files:
create_db.ipynbloads the data and stores them into the DB.sfo_db.ipynbcreates the table needed for the analysis on San Francisco airportanalysis.ipynbthe actual analysisdwh.pynot included in this repo, but needed for execution. Contains information about host, db, user, password needed to connect to the DB.sql_queries.pycontains the sql queries needed for creating the DB.test.ipynbsome queries to test the created DB.
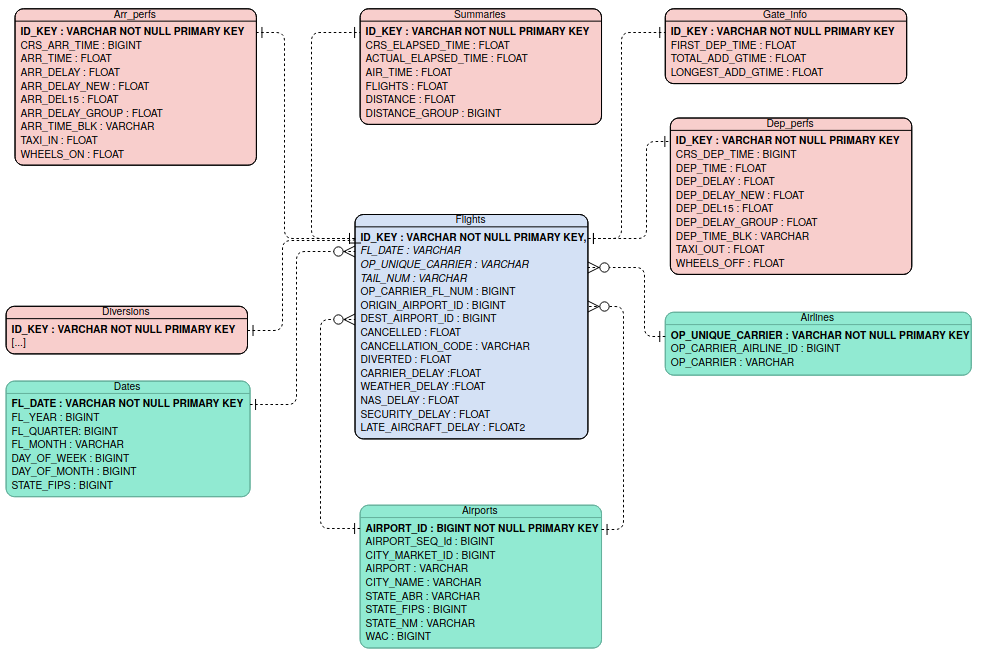
The Database schema consists of a star schema, in which however not all of the periferic tables are dimension tables. The database contains the following tables
- flights
- columns: ID_KEY (PRIMARY KEY),FL_DATE, OP_UNIQUE_CARRIER,TAIL_NUM,OP_CARRIER_FL_NUM,ORIGIN_AIRPORT_ID,DEST_AIRPORT_ID,CANCELLED,CANCELLATION_CODE,DIVERTED,CARRIER_DELAY,WEATHER_DELAY,NAS_DELAY,SECURITY_DELAY,LATE_AIRCRAFT_DELAY
-
airports -columns:AIRPORT_ID (PRIMARY KEY),AIRPORT_SEQ_ID,CITY_MARKET_ID,AIRPORT,CITY_NAME, STATE_ABR,STATE_FIPS,STATE_NM,WAC
-
airlines
- columns: OP_UNIQUE_CARRIER (PRIMARY KEY), OP_CARRIER_AIRLINE_ID,OP_CARRIER
- dates
- columns: FL_DATE (PRIMARY KEY),FL_YEAR,FL_QUARTER,FL_MONTH,DAY_OF_MONTH,DAY_OF_WEEK
- dep_perfs
- columns: ID_KEY (PRIMARY KEY),CRS_DEP_TIME,DEP_TIME,DEP_DELAY,DEP_DELAY_NEW,DEP_DEL15,DEP_DELAY_GROUP,DEP_TIME_BLK,TAXI_OUT,WHEELS_OFF
- arr_perfs
- columns: ID_KEY (PRIMARY KEY),WHEELS_ON,TAXI_IN,CRS_ARR_TIME,ARR_TIME,ARR_DELAY,ARR_DELAY_NEW,ARR_DEL15,ARR_DELAY_GROUP,ARR_TIME_BLK
- summaries
- columns: ID_KEY (PRIMARY KEY),CRS_ELAPSED_TIME,ACTUAL_ELAPSED_TIME,AIR_TIME,FLIGHTS,DISTANCE,DISTANCE_GROUP
- gate_info
- columns: ID_KEY (PRIMARY KEY),FIRST_DEP_TIME,TOTAL_ADD_GTIME,LONGEST_ADD_GTIME 5.diversions
- columns: all the remaining columns in the .csv files
The Entity Relation Diagram is as follows

The diagram is generated using Visual Paradigm. Primary keys are in bold font. I did not manage to do-undo italics to distinguish numerical entries...
An identifier key for each flight is created by appending the month to the number of the entry in the .csv file. E.g. the 42nd flight in May will be uniquely identified by the key 5_42.
Data are loaded from the .csv files into a staging table containing all the information. This is done by executing the function insert_csv. These are then divided into each table by executing the function fill_star_tables, which iterates through the queries in the list insert_queries.
- Execute the section
Introto create the key identifier and rename the columns to names that are not ambiguous for SQL. - create the INSERT queries
- Run
create_databaseto create the DB and get a cursor and a connection to it
- create the staging table by executing
create_table - load data in the staging table. This is done by iterating over the
.csvfiles in the data folder and executing the functioninsert_csvon each of them
- execute
drop_star_tablesto drop previously created tables - execute
create_star_tablesto create the tables of the star schema DB - execute
fill_star_tablesto copy the data from the staging tables to the tables of the star schema
Example queries for each of the tables can be found in the test.ipynb file. As an example, the query
SELECT tail_num, origin_airport_id FROM flights
WHERE cancelled = 1
LIMIT 1;
should return
| tail_num | origin_airport_id |
|---|---|
| N123NN | 13830 |
To get the table needed for the analysis on flights from SFO we need to execute the file sfo_db.ipynb. This file consists of the following steps:
- substitutes all the
NaNin the delays with zeros - creates a table that only selects the flights departing from SFO and restricts to the columns that are relevant from our analysis
The analysis on flight delays from SFO is performed in the file analysis.ipynb. This consists of two parts. First I focus on how often each type of delay occurs. For this analysis, the data are selected from the sfo table. The query executed is
SELECT op_unique_carrier,
    COUNT(carrier_delay) AS totalflights,
    COUNT(NULLIF(carrier_delay,0)) AS carrier,
    COUNT(NULLIF(weather_delay,0)) AS weather,
    COUNT(NULLIF(nas_delay,0)) AS nas,
    COUNT(NULLIF(security_delay,0)) AS security,
    COUNT(NULLIF(late_aircraft_delay,0)) AS late_aircraft
FROM sfo
GROUP BY CUBE(op_unique_carrier);
which counts the number of occurrencies of each type of delay, both for each of the carriers and in total. This data is then stored into a pandas dataframe and converted into percentages, into a new dataframe containing the following columns:
totalflights: how many of the total flights from SFO are operated from this companycarrier: how many of the delays of the carrier are due to carrier delaysweather: how many of the delays of the carrier are due to weathernas: how many of the delays of the carrier are due to NASsecurity: how many of the delays of the carrier are due to securitylate_aircraft: how many of the delays of the carrier are due to late aircrafttotaldelays: how many of the total delays are from this specific carrierdelayed_to_total: how many of the flights of this carrier are delayed
In order to compare companies, we display two heatmaps:
- the first one showing the percentages of causes of delays, for each company and overall
- the second one showing the
totalflightsand thetotaldelaysfor each carrier And also some pie plots and bar charts.
Part two of the analysis consists of a comparison of the American Airlines data from the ones collected among all carriers, and focuses on the delay causes that are imputable to the carrier, i.e. carrier_delay and late_aircraft_delay. For each of the two delays, we plot the distribution of delay minutes, for both AA and in general, and also display some statistically relevant figures:
- median
- mean
- max
- standard deviation