- OpenShift 4.10+ on IBM Z or LinuxONE
- Cluster administrator privileges
- Basic OpenShift knowledge including how to log into OpenShift through the web console and CLI, navigation and use of each.
Scalability is one of the primary reasons the IT world is moving large portions of its workloads to Kubernetes and container platforms such as Red Hat OpenShift. Kubernetes' ability to rapidly scale containerized applications to suit user demand provides developers and cloud operators the flexibility to deploy an application without knowing exactly how many resources will be consumed or when they will be consumed.
Two of the ways that Kubernetes provides rapid scalability are Horizontal Pod Autoscaling and Vertical Pod Autoscaling.
Horizontal Pod Autoscaling automatically changes the number of Pods in a workload resource, such as a Deployment. When Kubernetes notices that there is an increased load on an application, it will automatically scale up up the number of Pods, and when the load decreases, it will automatically scale down the number of Pods.
Vertical Pod Autoscaling, on the other hand, will automatically adjust the resource requests and limits for a workload resource, such as a Deployment. Instead of scaling the number of Pods up or down, the number of Pods stays the same, but each is allowed to use more CPU or memory than originally set.
With OpenShift 4.10, both the Horizontal and Vertical Pod Autoscalers are now supported on IBM zSystems and LinuxONE OpenShift clusters.
Operators and cloud administrators might be hesitant to give an OpenShift application free reign to scale its number of pods based on user demand. Imagine if a business critial application is suddenly hit with far more requests than normal due to an event like Black Friday shopping, a viral video that references a webpage, or a malicious DDOS attack. One can imagine thousands of pods being scaled up, surpassing the quantity that can be supported by the OpenShift cluster or the hardware it's running on.
Fortunately, as you'll see in the rest of this section, the OpenShift (Kubernetes) Pod Autoscalers require certain parameters be set that avoid the possiblity of catastrophe, such as maximum/minimun number of Pods, resource limits, resource requests, and percentage of resource requests that prompts the Autoscaler to take action.
To get started with the demonstration, create an application on the OpenShift cluster that will be used to show the autoscaling functions.
Please note that all of the following steps can be completed either in the OpenShift web console or through the OpenShift command line. This demonstration will swap between the two methods.
- Log into your OpenShift cluster using OpenShift command line.
You can find credentials and all necessary information from the OpenShift on IBM Z - Bastion with Single Master Node tile in your TechZone My Reservations Page. Further details can be found within your Project Kit, which is linked on your reservation page.
- Create a new project.
oc new-project hpa-demo
- In the new project, deploy a pre-built Quarkus container image.
oc new-app --image=quay.io/mmondics/autoscale-quarkus:v1 --name=autoscale-quarkus
Click to expand sample output
--> Found container image 2bc8c02 (11 hours old) from quay.io for "quay.io/mmondics/autoscale-quarkus:v1"

    Java Applications
    -----------------
    Platform for building and running plain Java applications (fat-jar and flat classpath)

    Tags: builder, java

    * An image stream tag will be created as "autoscale-quarkus:v1" that will track this image

--> Creating resources ...
    imagestream.image.openshift.io "autoscale-quarkus" created
    deployment.apps "autoscale-quarkus" created
    service "autoscale-quarkus" created
--> Success
    Application is not exposed. You can expose services to the outside world by executing one or more of the commands below:
    'oc expose service/autoscale-quarkus'
    Run 'oc status' to view your app.
- Expose the Service to create a Route.
oc expose service/autoscale-quarkus
By default, you have one Quarkus Pod running in your project that is responsible for all requests that hit the application.
- Look at your one pod.
oc get pods
NAME                                 READY   STATUS    RESTARTS   AGE
autoscale-quarkus-597c7d55cb-jdplh   1/1     Running   0          74s
Because there is only one replica of the Quarkus application running, it is solely responsible for all requests that come into the cluster through its exposed Route. Furthermore, because no resource requests or limits have been set for this application, it has the capability to use as many resources as it needs with no upper bound. This is clearly not a viable setup for production workloads or any situation where high availability and performance are needed. For this reason, setting resource requests and limits is considered a best practice. Furthermore, they are required for horizontal and vertical Pod autoscaling, so the next step is to set these for the Quarkus Deployment.
- Find your Pod's current memory usage.
oc adm top pod
NAME                                 CPU(cores)   MEMORY(bytes)
autoscale-quarkus-597c7d55cb-qkhxj   0m           68Mi
In the example output above, the current memory utilization is 89 Mi. Your value will vary - take note of it for use in the next step.
- Navigate to your OpenShift web console and find your Quarkus Deployment.
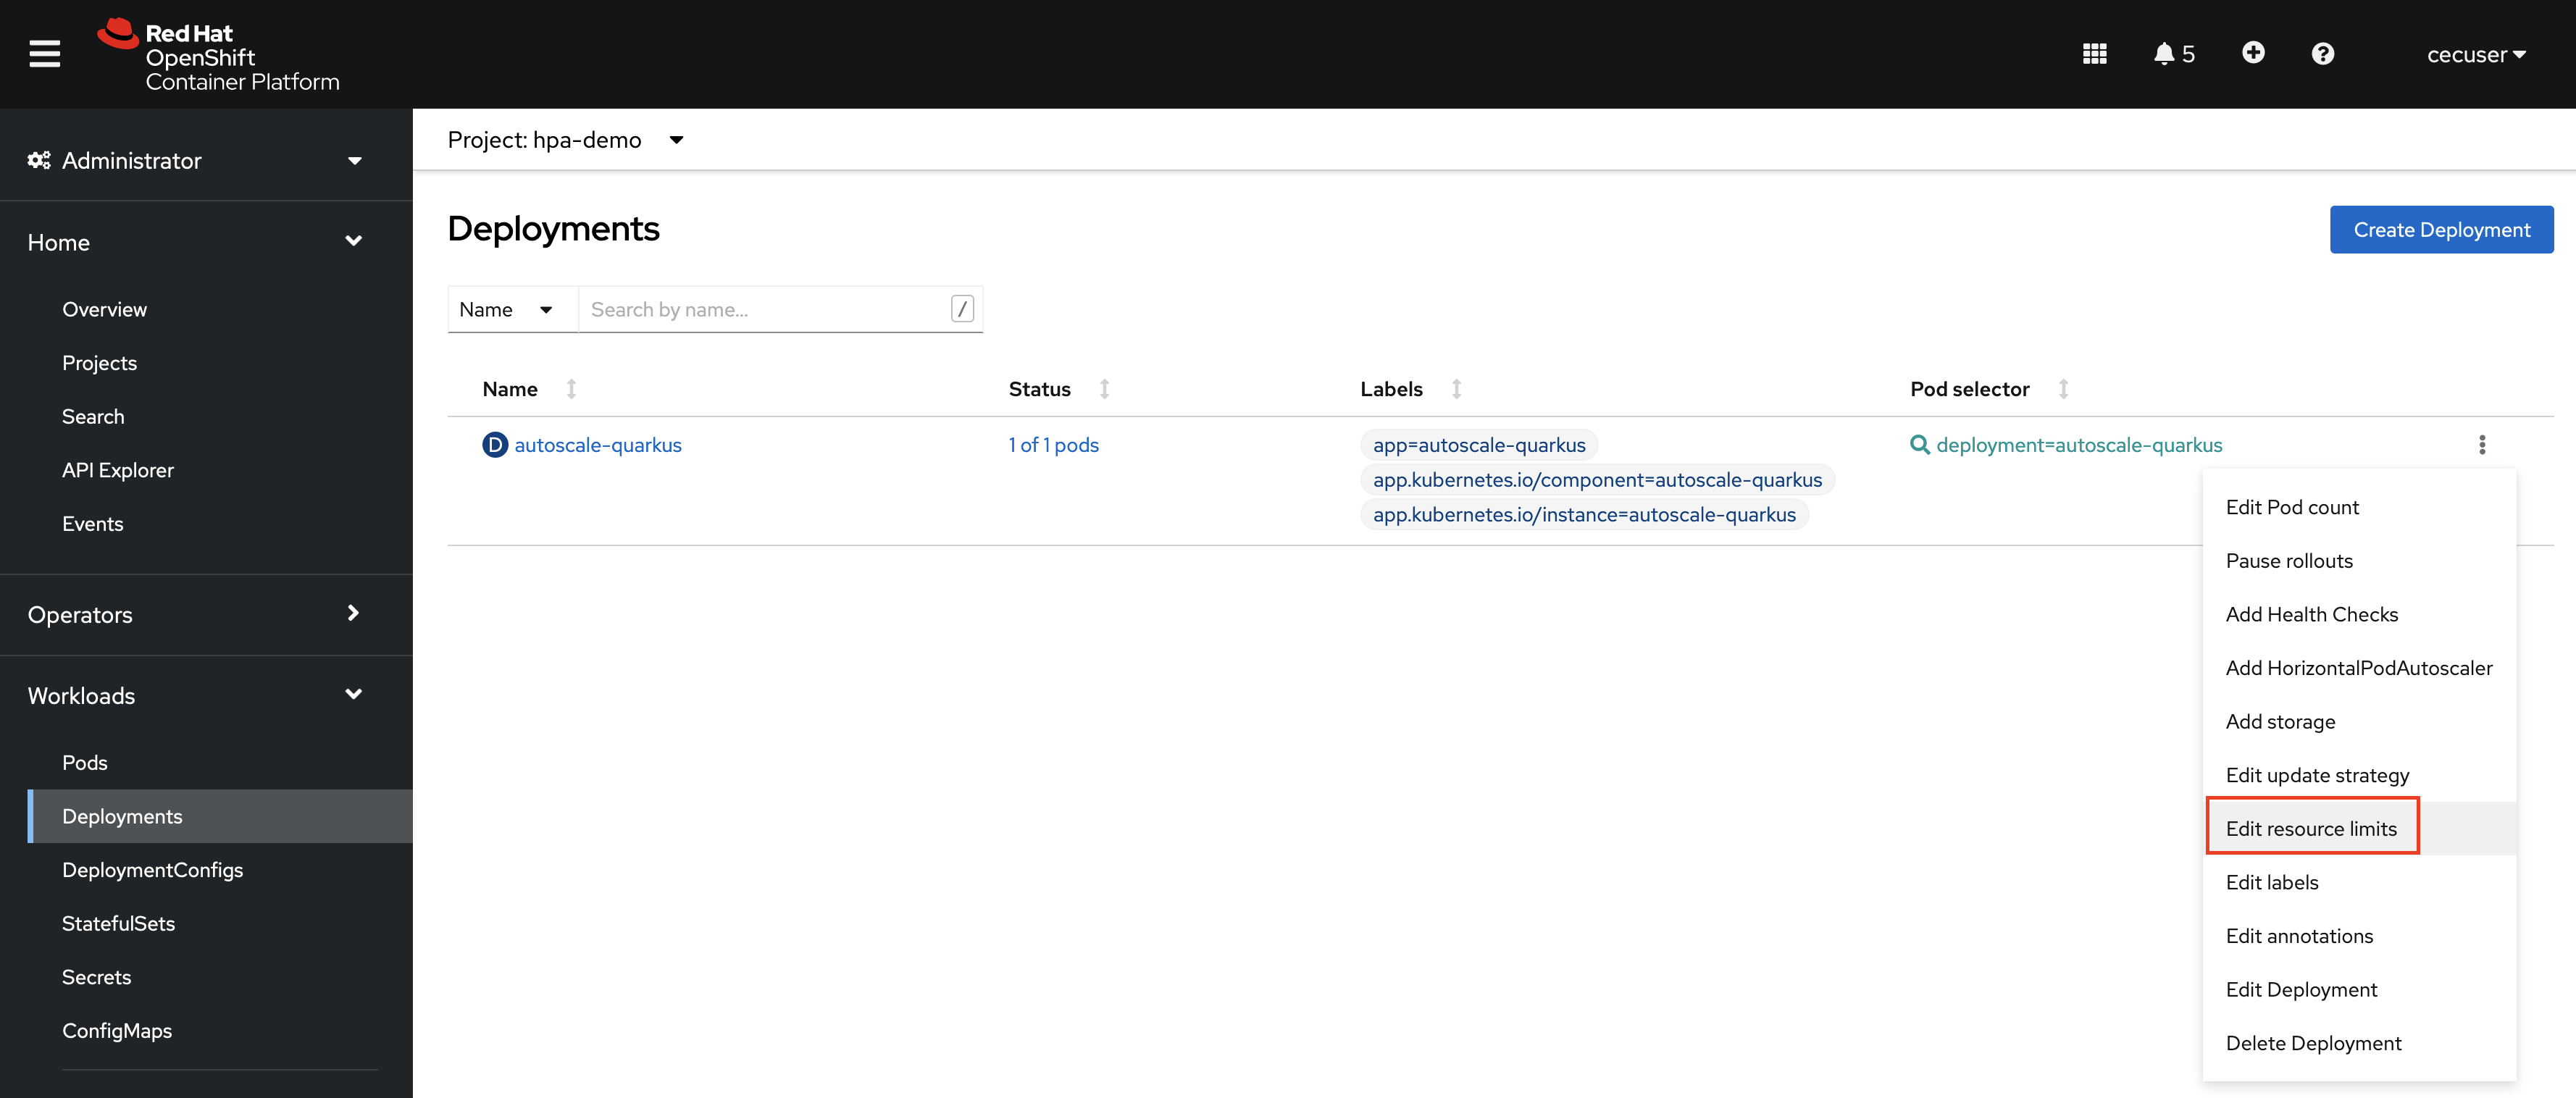
Under the Administrator perspective, navigate to Worklaods -> Deployments and make sure you're in the autoscaling-demo project.
- Click on the three dots associated with the Quarkus Deployment, then click Edit resource limits.
- Set the following resource requests and limits.
- CPU Request: 5 millicores
- CPU Limit: 10 millicores
- Memory Request: <DOUBLE_YOUR_CURRENT_USAGE> Mi
- Memory Limit: <TRIPLE_YOUR_CURRENT_USAGE> Mi
For example, because the current memory utilization of the Quarkus application when developing this demonstration was 68Mi, the Memory Request was set at 136 Mi and the Memory Limit was set at 204 Mi.
These requests and limits tell OpenShift that each Pod in the Quarkus Deployment is guaranteed access to 5 millicores of CPU and double your curent usage of memory. On the other hand, each Pod has a limit of 10 millicores CPU and triple your current usage of memory. This is a Java application that its much more memory-intensive compared to CPU, and was built with an endpoint we will hit to fill the memory even more. Therefore the CPU limits set in this step won't actually do anything or be acted upon during this demonstration.
For more information about Kubernetes resource requests and limmits, you can read the documentation here.
- Click Save for the changes to be applied to the Deployment and for a new Pod to spin up.
Next, you will need to create a HorizontalPodAutoscaler that defines the scaling boundries and triggers for autoscaling to occur.
- In the OpenShift web console, click the three dots associated with the Quarkus Deployment once again, then select Add HorizontalPodAutoscaler and fill in the fields with the following values.
- Minimum Replicas: 1
- Maximum Replicas: 5
- Target CPU Percent: 55%
These parameters are telling OpenShift that the Quarkus application must have a minimum of 1 Pod, a maximum of 5 Pods, and to increase the Pod count whenever the CPU usage surpasses 55% of the CPU resource limit set in the above step (136 Mi). Therefore, whenever a Pod hits 75 Mi CPU usage ~(55% * 136 Mi), another Pod will be created.
Note that a 55% memory utilization threshold is probably too low for a production workload and would likely trigger autoscaling very often. This number is being used for demonstration purposes only because we want to ensure autoscaling occurs.
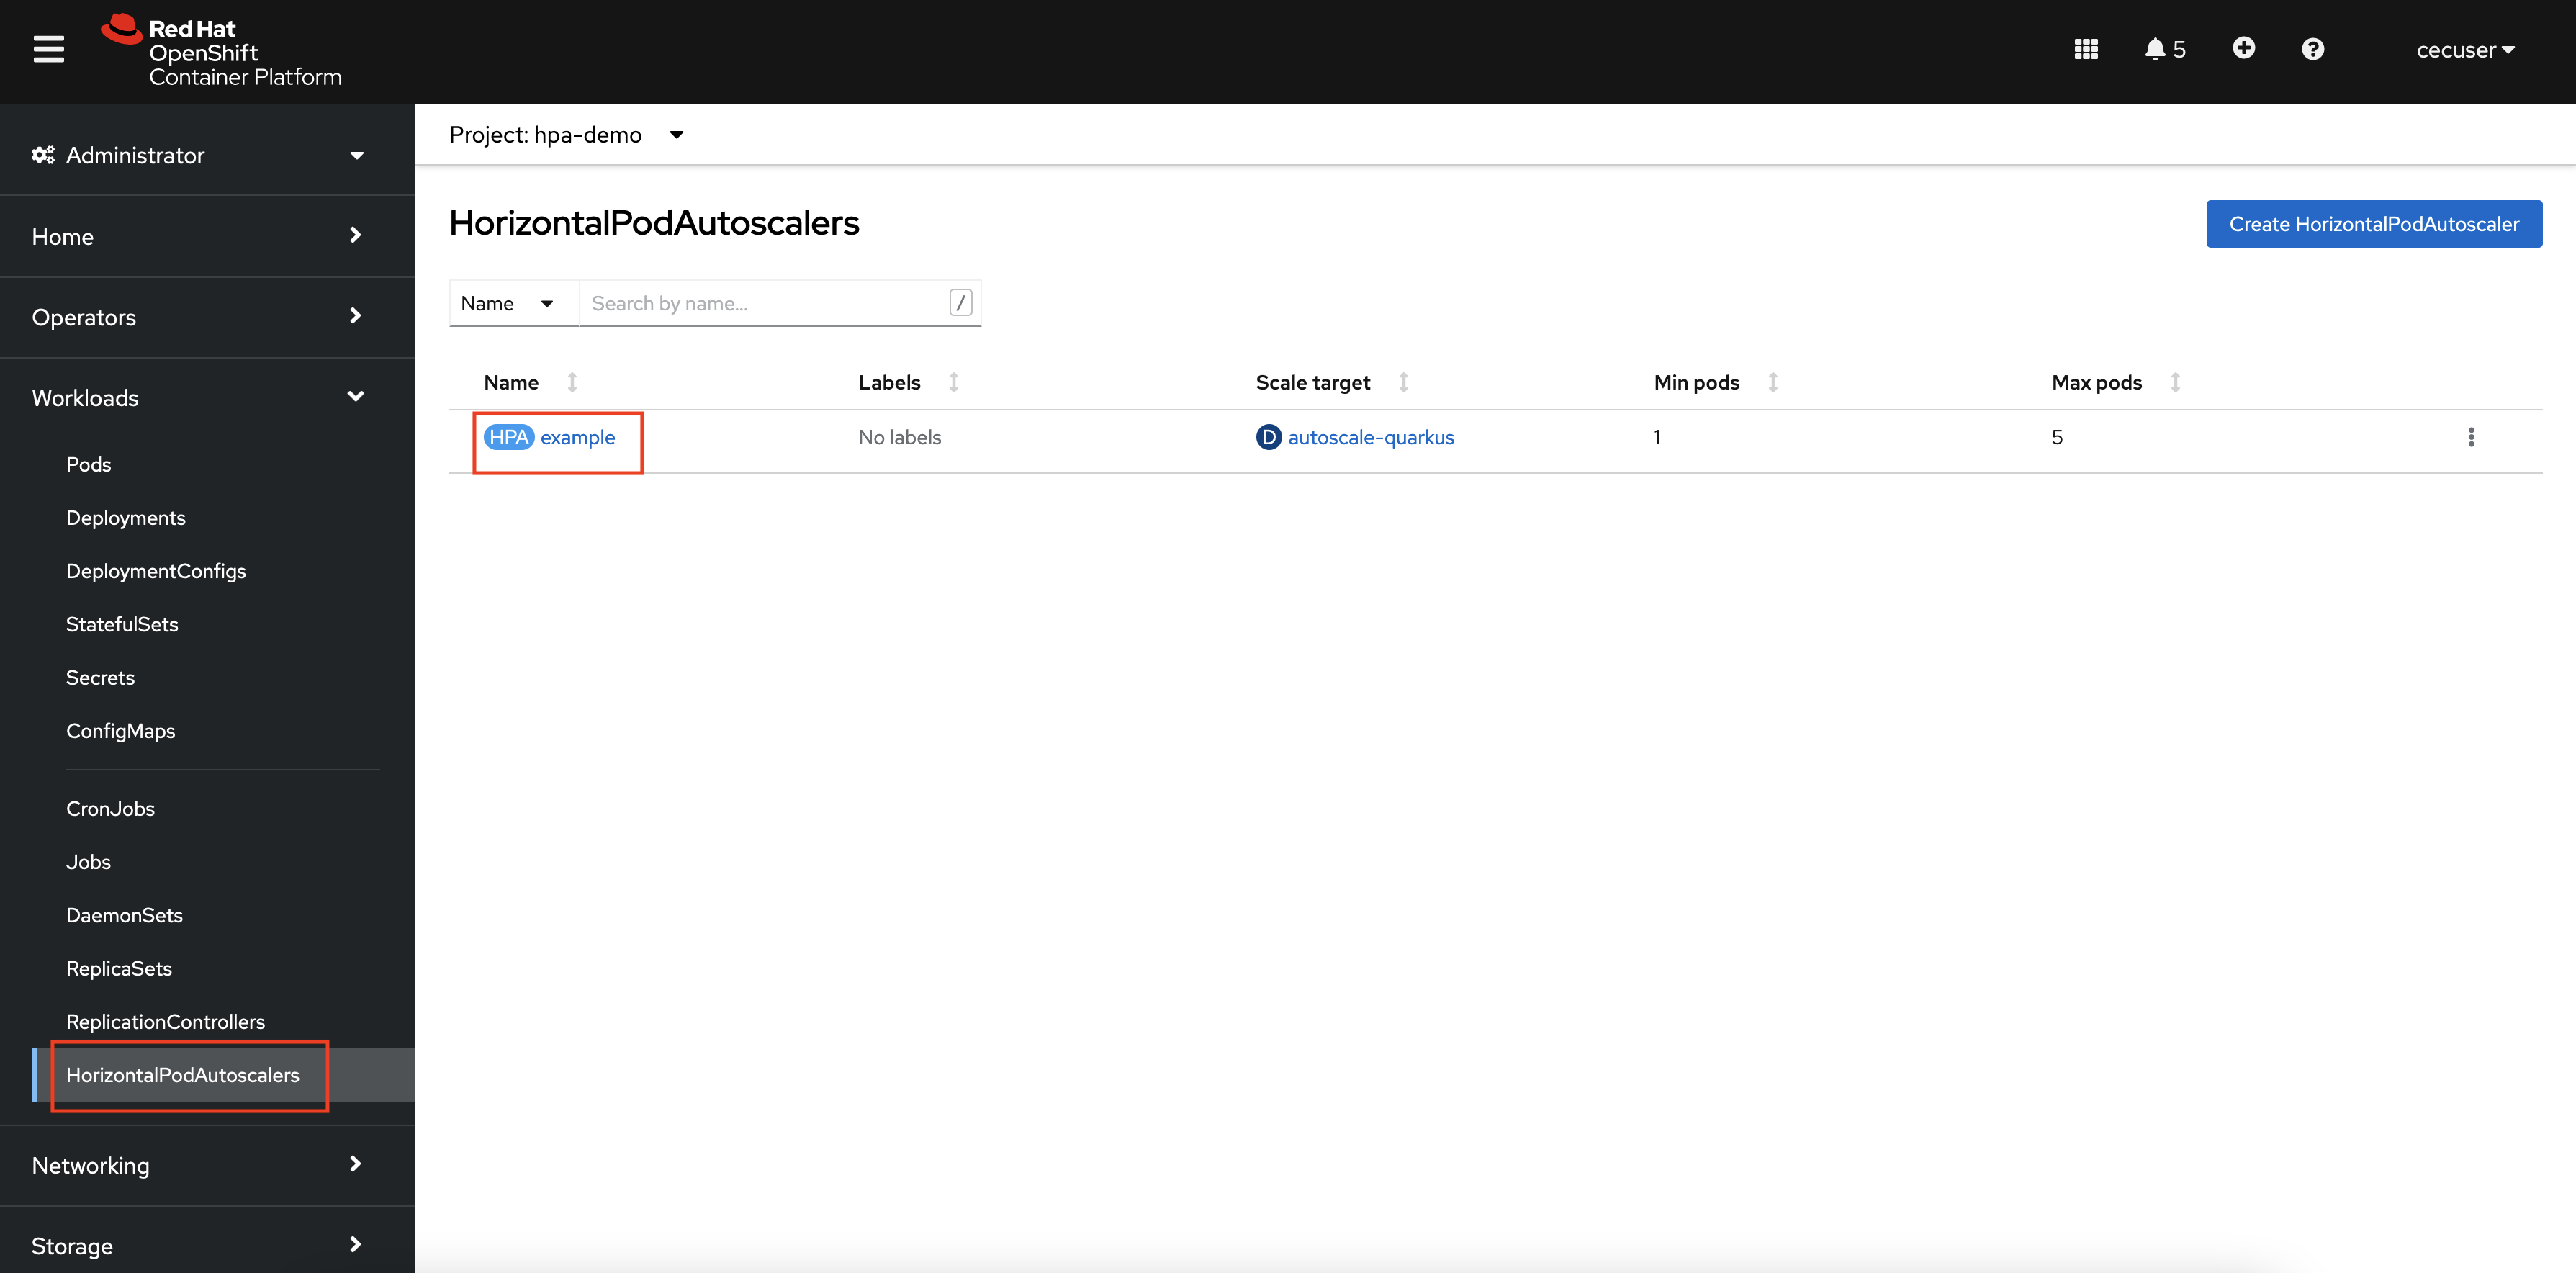
- Navigate to the HorizontalPodAutoscalers page in the OpenShift console, and click the HPA named
example(unless you provided a different name).
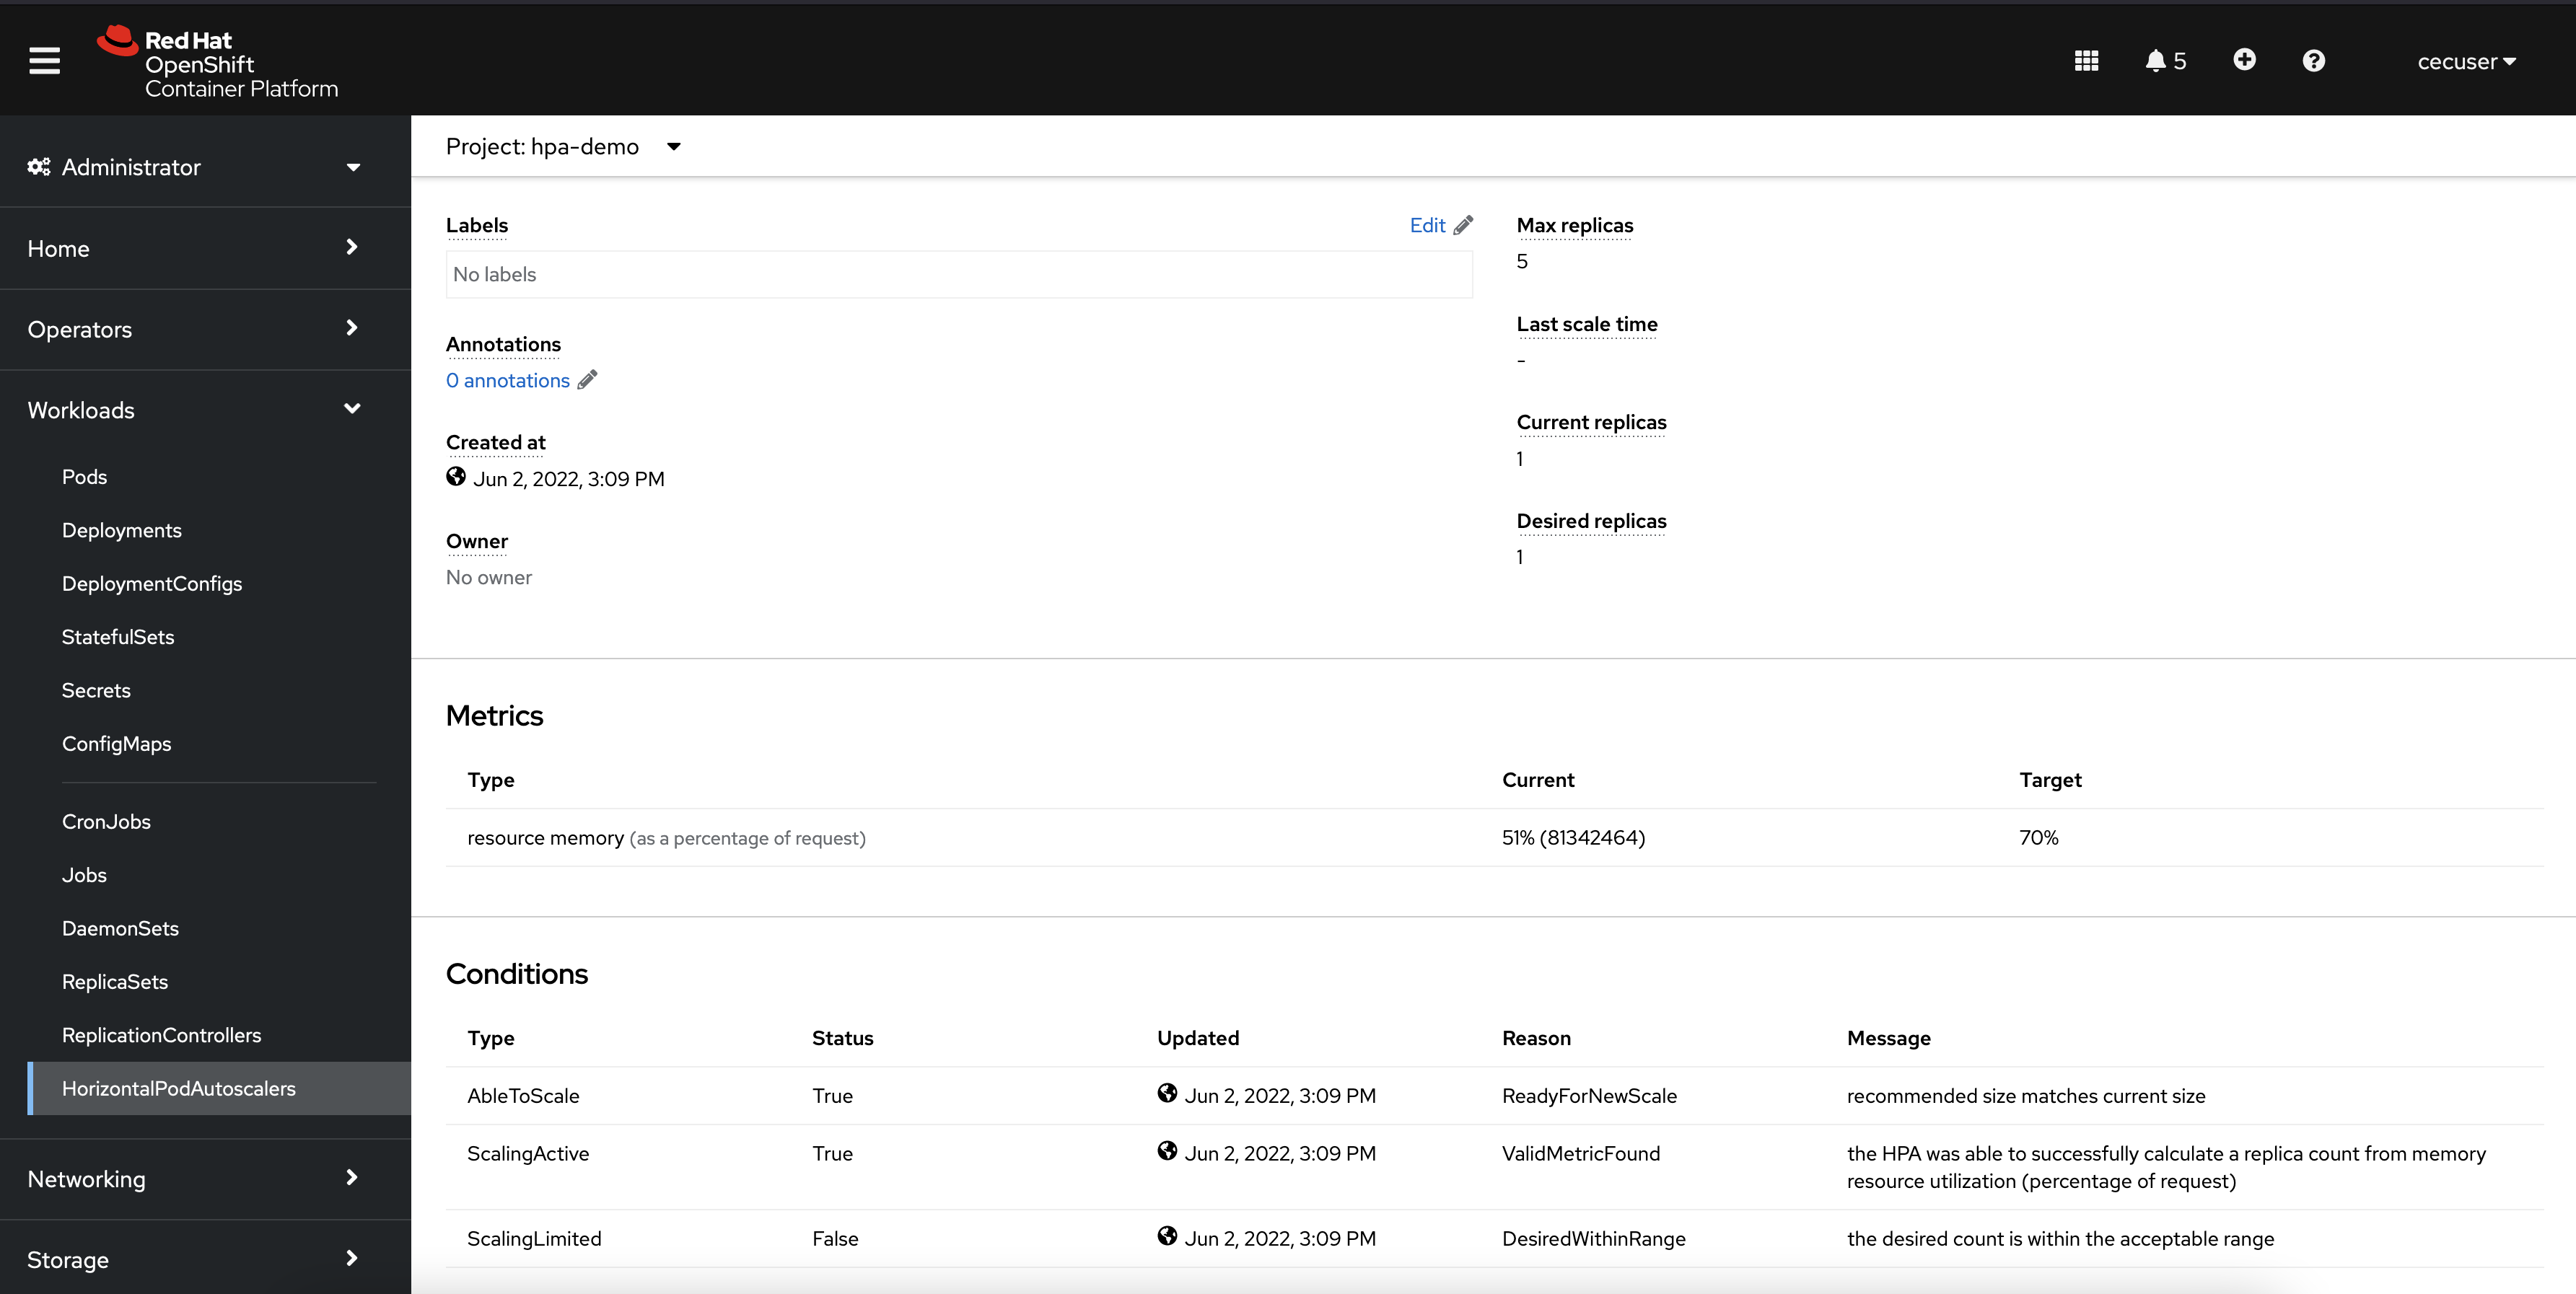
On the page for your HPA, you can see information about the current and desired replica count, the current memory usage and the target of 55%, and messages about the conditions of the HPA. Unless something in your environment is vastly different than that of the environment used when developing this demonstration, you should only have 1 desired and current replica, and about 50% for current memory usage as a precentage of the request.
In the next step, you will run a simple for loop that will run 100 iterations of a curl command against an endpoint built into the Quarkus application that uses the fill() method to add dummy data into memory.
Click to see the code.
@GET
@Path("fill/{index}")
@Produces(MediaType.TEXT_PLAIN)
public String fill(@PathParam("index") String index) throws Exception {

    HashMap<String, String> mem = new HashMap<String, String>();
    char[] chars = new char[2 * 1024 * 1024];
    Arrays.fill(chars, 'f');
    mem.put(Math.random() + "", new String(chars));
    System.out.println("Added " + index + "MB");
    return "Added " + index + "MB \n";
}- From your command line terminal, set the hostname of your Quarkus application route as the variable
$QUARKUS_HOST.
QUARKUS_HOST=$(oc get route autoscale-quarkus -o=jsonpath='{.spec.host}')
- Annotate your Quarkus application route to use the round-robin load balancing algorithm.
oc annotate route autoscale-quarkus haproxy.router.openshift.io/balance=roundrobin
This will ensure that as new pods are created, requests are balanced evenly among them.
- Run the following command to add dummy data into memory. This command will take ~200 seconds to run - continue to the next step while it runs.
for ((i = 1; i <= 100; i++ )); do curl http://$QUARKUS_HOST/hello/fill/$i ; sleep 2 ; done
On your HorizontalPodAutoscalers page in the OpenShift console, you will start to see the current memory usage increase until it reaches the target (55%). Shortly after the threshold is met, a new Pod will be created.
If your memory utilization is not reaching 55%, open another terminal session and run another instance of the above for loop concurrently. You can open as many sessions as you need to send enough requests.
- Once one or more new pods have been created, navigate to the Pods page in the OpenShift console.
Alternatively, you can run the command oc get pods in the CLI.
NAME                                 READY   STATUS              RESTARTS   AGE
autoscale-quarkus-5b6b645f64-22s7c   1/1     Running             0          22s
autoscale-quarkus-5b6b645f64-5ccnd   1/1     Running             0          53m
autoscale-quarkus-5b6b645f64-8mxvj   1/1     ContainerCreating   0          22s
autoscale-quarkus-5b6b645f64-ckvbz   0/1     Running             0          7s
autoscale-quarkus-5b6b645f64-wmcvm   1/1     Running             0          22s
TODO: add a wrap up section here.
The HorizontalPodAutoscaler object created in the hpa-demo project can be modified with more parameters to customize the behavior of the autoscaling. For example, Scaling Policies can be used to control the rate at which the pods scale up or down by setting a specific number or specific percentage to scale in a specified period of time. Further configuration is outside the scope of this demo, but you can read more about HPA customization in the OpenShift documentation here.
While Horizontal Pod Autoscaling is helpful for handling sudden or unexpected changes in resource usage, it doesn't do much to fix one of the most common issues in microservice development and administration - improperly sized applications. When you deploy an application with Kubernetes, you set the requests and limits for CPU and memory, and then they keep those set values unless and until someone goes in and manually changes them. This is antithetical to the Kubernetes objective to be an automated, hands-off container orchestration platform that takes care of these tedious tasks.
The Vertical Pod Autoscaler (VPA) solves this problem by allowing Kubernetes to right-size application resource limits based on their historic use. The VPA constantly reviews the historic CPU and memory use for specified pods and compares them to current use. If the VPA decides that the resource limits should be updated, it will either recommend new values for you to manually update, or automatically update the resource limits to the recommended values if you allow the VPA to do so.
From a developer's point of view, allowing the VPA to recommend or apply new amounts of CPU and memory allocated to an application removes the need for developers to know exactly how many resources will be used once the application is put into production. It is not uncommon for developers to have to guess how their code will perform when moved from a dev/test environment into production. And even if the developers have a production-like environment for their dev/test, it is very difficult to guess how many resources will be consumed once end users start accessing the production application. Furthermore, CPU and memory usage are often dynamic values that increase as time passes or vary with the time of year. For many applications, it doesn't make sense to keep the initial values for CPU and memory for the whole life of the application.
From an administrator's point of view, the VPA helps to improve stability of workloads, as well as improving their cost efficiency. Having too few resources can lead to degraded application performance or even disruptive errors. Having too many resources can lead to waste and degraded performance of other applications because the CPU and memory are unnecessarily committed to applications that don't need them.
The Vertical Pod Autoscaler is a great tool to help cloud native developers and administrators focus on their many tasks by outsourcing the application sizing to OpenShift Container Platform.
The VPA process flow is as follows:
- Vertical Pod Autoscaler operator is installed in the OpenShift cluster
- VPA object is created and watches an application resources such as a Deployment
- VPA monitors and analyzes application resource usage for a period of time
- The VPA determines that resource limits need updated, at which point it will either:
- Recommend new values for resource limits, or
- Automatically apply new values for resource limits
The action in step 4 depends on how an administrator configured the VPA. If the VPA is allowed to automatically apply new resource limits, the existing application pods will be terminated and new pods with the updated values will be started.
To get started with the VPA part of this demonstration, you will need to deploy another application and define resource limits for it. For the sake of variety, let's deploy a different application than we did in the previous section.


