
Implementation of Julia types for summarizing MCMC simulations and utility functions for diagnostics and visualizations.
The following simple example illustrates how to use Chain to visually summarize a MCMC simulation:
using MCMCChain
using Plots, StatPlots
theme(:ggplot2);
# Define the experiment
n_iter = 500;
n_name = 3;
n_chain = 2;
# experiment results
val = randn(n_iter, n_name, n_chain) .+ [1, 2, 3]';
val = hcat(val, rand(1:2, n_iter, 1, n_chain));
# construct a Chains object
chn = Chains(val);
# visualize the MCMC simulation results
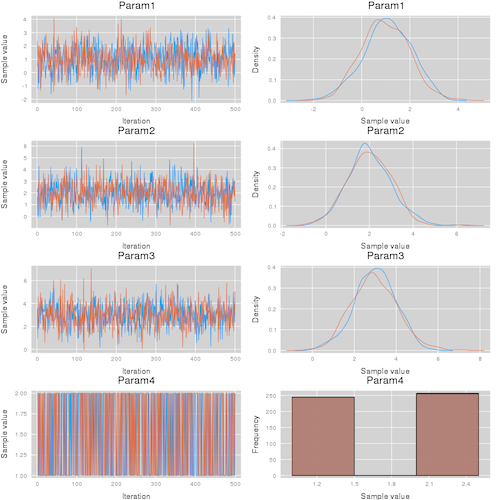
p1 = plot(chn)
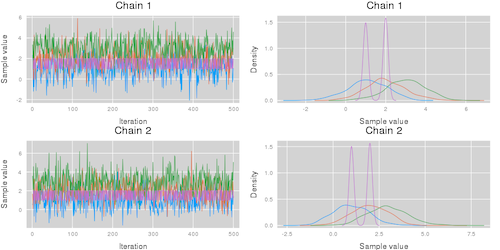
p2 = plot(chn, colordim = :parameter)
# save to a png file
savefig(p1, "demo-plot-parameters.png")
savefig(p2, "demo-plot-chains.png")
This code results in the visualizations shown below. Note that the plot function takes the additional arguments described in the Plots.jl package.
| Summarize parameters | Summarize chains |
|---|---|
plot(chn; colordim = :chain) |
plot(chn; colordim = :parameter) |
 |
 |
# construction of a Chains object
Chains(iterations::Int, params::Int;
    start = 1, thin = 1, chains = 1,
    names = String[])

# construction of a Chains object using an
# iteration * params * chains
# array (values).
Chains(values::Array{T, 3};
    start = 1, thin = 1, chains = 1,
    names = String[])

# Indexing a Chains object
chn = Chains(...)
chn_param1 = chn[:,2,:] # returns a new Chains object for parameter 2
chn[:,2,:] = ... # set values for parameter 2Options for method are [:weiss, :hangartner, :DARBOOT, MCBOOT, :billinsgley, :billingsleyBOOT]
discretediag(c::AbstractChains; frac=0.3, method=:weiss, nsim=1000)gelmandiag(c::AbstractChains; alpha=0.05, mpsrf=false, transform=false)gewekediag(c::AbstractChains; first=0.1, last=0.5, etype=:imse)heideldiag(c::AbstractChains; alpha=0.05, eps=0.1, etype=:imse)rafterydiag(c::AbstractChains; q=0.025, r=0.005, s=0.95, eps=0.001)# construct a plot
plot(c::AbstractChains; ptypes = [TracePlot, MixedDensityPlot])
plot(c::AbstractChains; [:trace, :mixeddensity]) # deprecated
# construct trace plots
plot(c::AbstractChains, TracePlot)
plot(c::AbstractChains, :trace) # deprecated
# construct running average plots
plot(c::AbstractChains, MeanPlot)
plot(c::AbstractChains, :mean) # deprecated
# construct density plots
plot(c::AbstractChains, DensityPlot)
plot(c::AbstractChains, :density) # deprecated
# construct histogram plots
plot(c::AbstractChains, HistogramPlot)
plot(c::AbstractChains, :histogram) # deprecated
# construct mixed density plots
plot(c::AbstractChains, MixedDensityPlot)
plot(c::AbstractChains, :mixeddensity) # deprecated
# construct autocorrelation plots
plot(c::AbstractChains, AutocorPlot)
plot(c::AbstractChains, :autocor) # deprecatedNote that this package heavily uses and adapts code from the Mamba.jl package licensed under MIT License, see License.md.