{ggbuilder} is experimental alternative approach to specifying
individual ggplot2 layers. It was
inspired by an observation made by June Choe in his RStudio::conf 2022
talk:
some elements of a layer specification (i.e. calls to geom_XXX() or
stat_XXX()) tend to be written out-of-order compared to how those
elements are actually executed by ggplot2, which may make it hard to
reason about. {ggbuilder} provides an alternative syntax for specifying
layers that mimics familiar data transformation pipelines, and attempts
to put operations in the same order syntactically as they are actually
executed.
You can install the development version of ggbuilder from GitHub with:
# install.packages("devtools")
devtools::install_github("mjskay/ggbuilder")Here is a simple dataset, visuallized using normal ggplot2 syntax:
library(ggplot2)
library(ggbuilder)
library(dplyr)
theme_set(theme_light())

set.seed(123456)
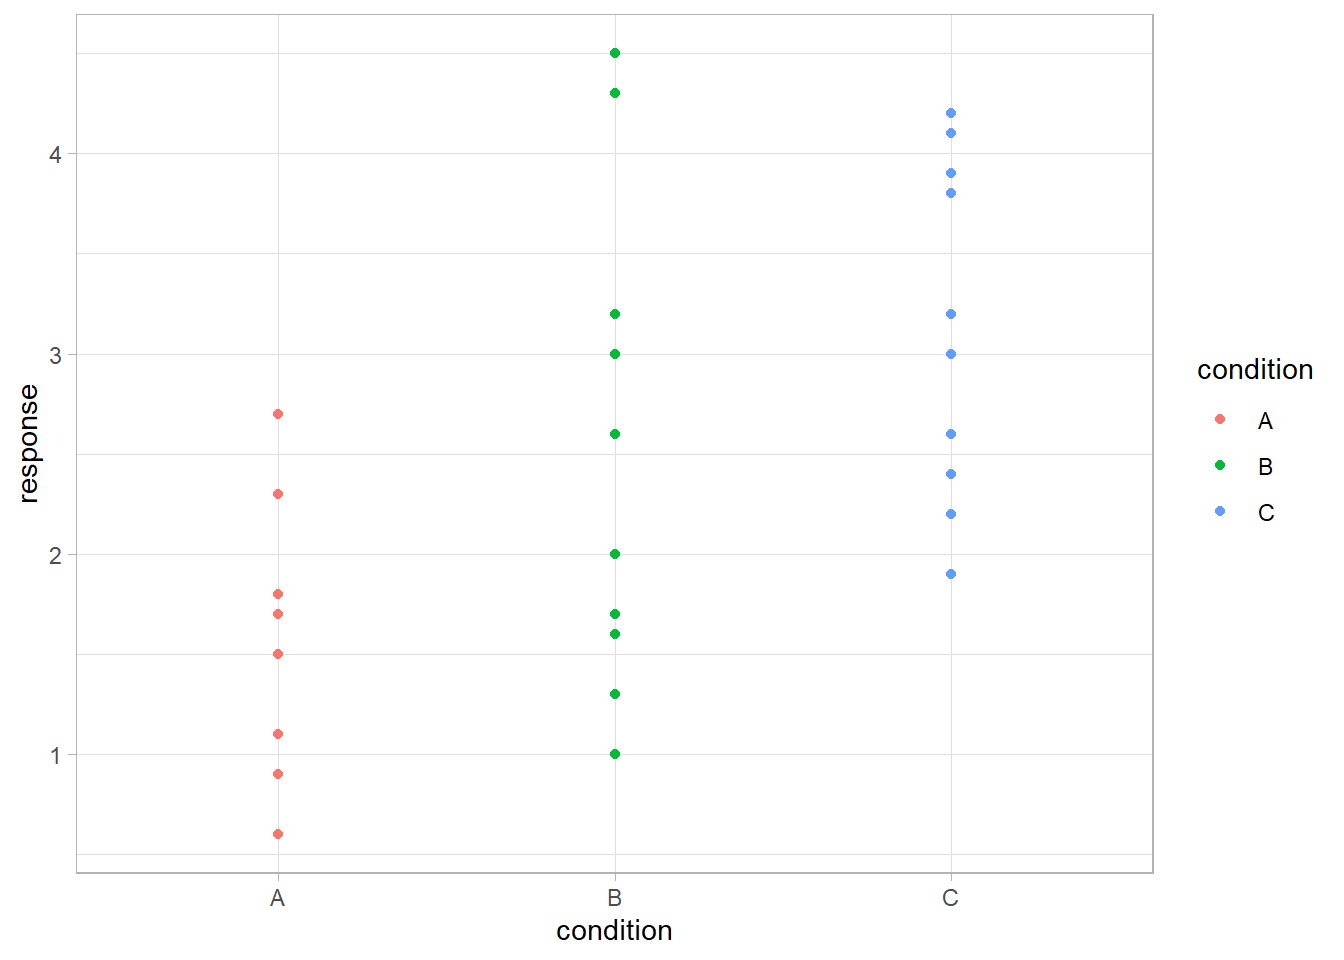
df = data.frame(condition = c("A", "B", "C"), response = round(rnorm(30, 1:3), 1))
df |>
  ggplot(aes(x = condition, y =  response, color = condition)) +
  geom_point()
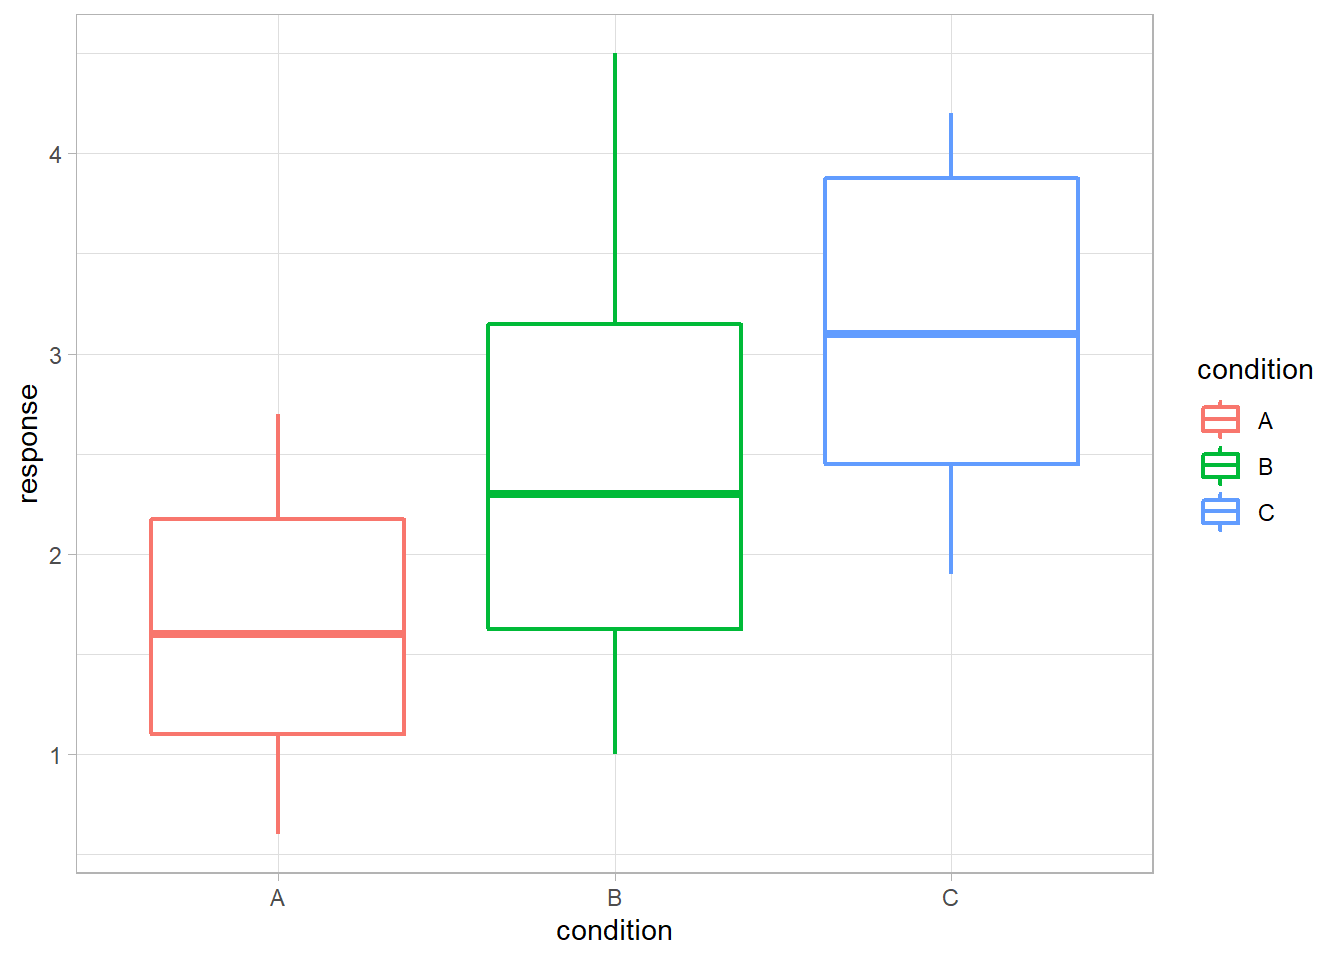
Or you might try use a boxplot instead (though personally I would probably use something from ggdist instead ;) )
df |>
  ggplot(aes(x = condition, y =  response, color = condition)) +
  geom_boxplot(size = 0.75)
To translate the above to {ggbuilder}, we can start by replacing calls
of the form geom_XXX(...) or stat_XXX(...) with geom_("XXX", ...)
or stat_("XXX", ...). These will work just as before:
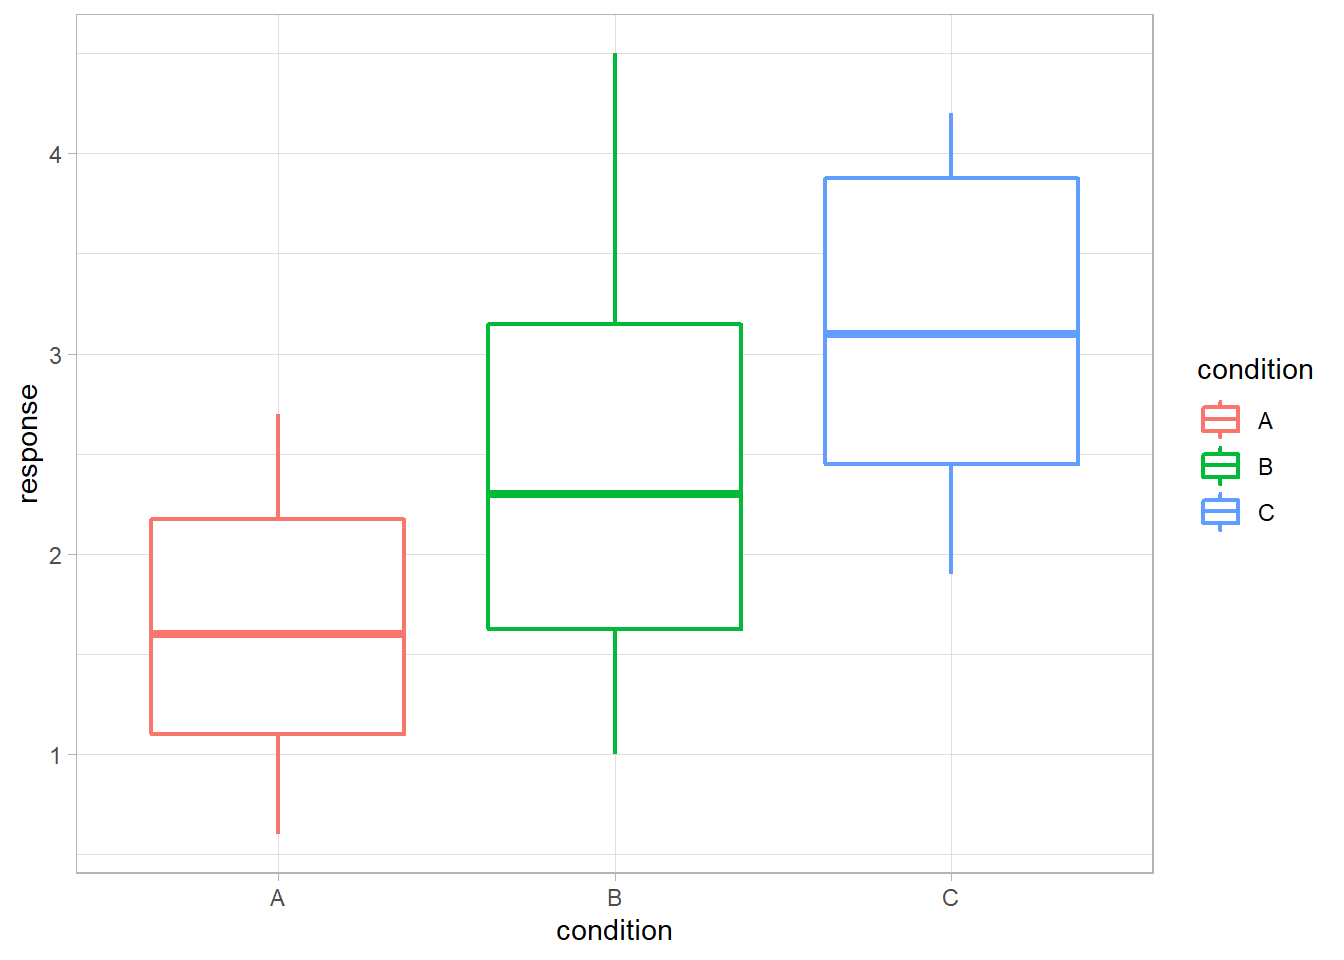
df |>
  ggplot(aes(x = condition, y =  response, color = condition)) +
  geom_("boxplot", size = 0.75)
It works just as before, except that the objects created by calls to
geom_() and stat_() are both traditional ggplot2 layers and
ggbuilder layer specifications, which can be chained together using
the pipe: |>.
geom_("boxplot", size = 0.75)
#> <ggbuilder::layer>:
#> mapping:
#> geom_boxplot: outlier.colour = NULL, outlier.fill = NULL, outlier.shape = 19, outlier.size = 1.5, outlier.stroke = 0.5, outlier.alpha = NULL, notch = FALSE, notchwidth = 0.5, varwidth = FALSE, na.rm = FALSE, orientation = NA
#> stat_boxplot: na.rm = FALSE, orientation = NA
#> position_dodge2
#>
#> from <ggbuilder::layer_spec>:
#> $params
#> $params$size
#> [1] 0.75
#>
#>
#> $mapping_stat
#> Aesthetic mapping:
#> <empty>
#>
#> $mapping_geom
#> Aesthetic mapping:
#> <empty>
#>
#> $mapping_final
#> Aesthetic mapping:
#> <empty>
#>
#> $geom
#> [1] "boxplot"
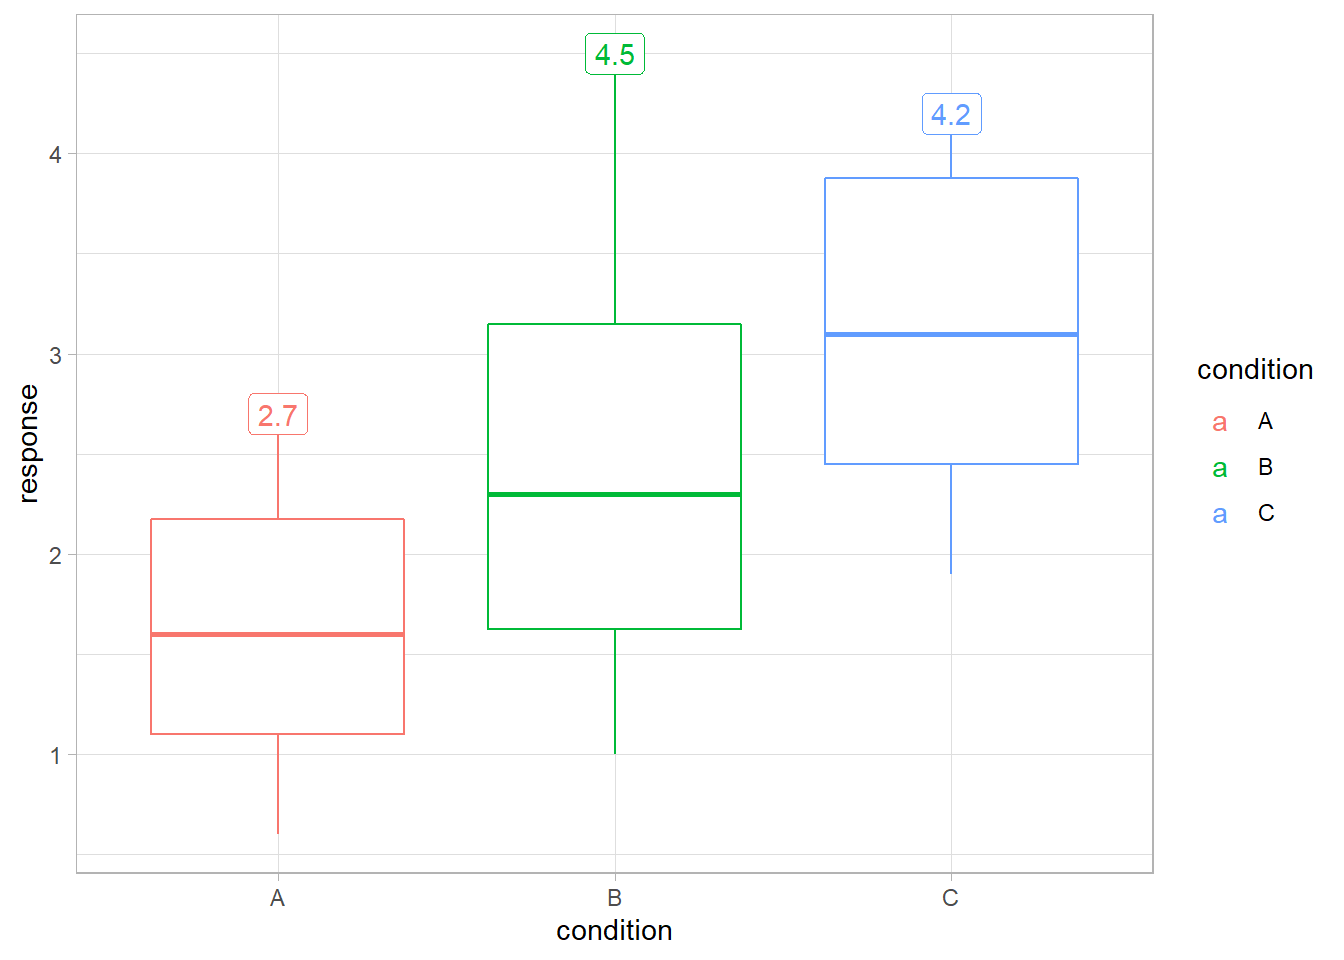
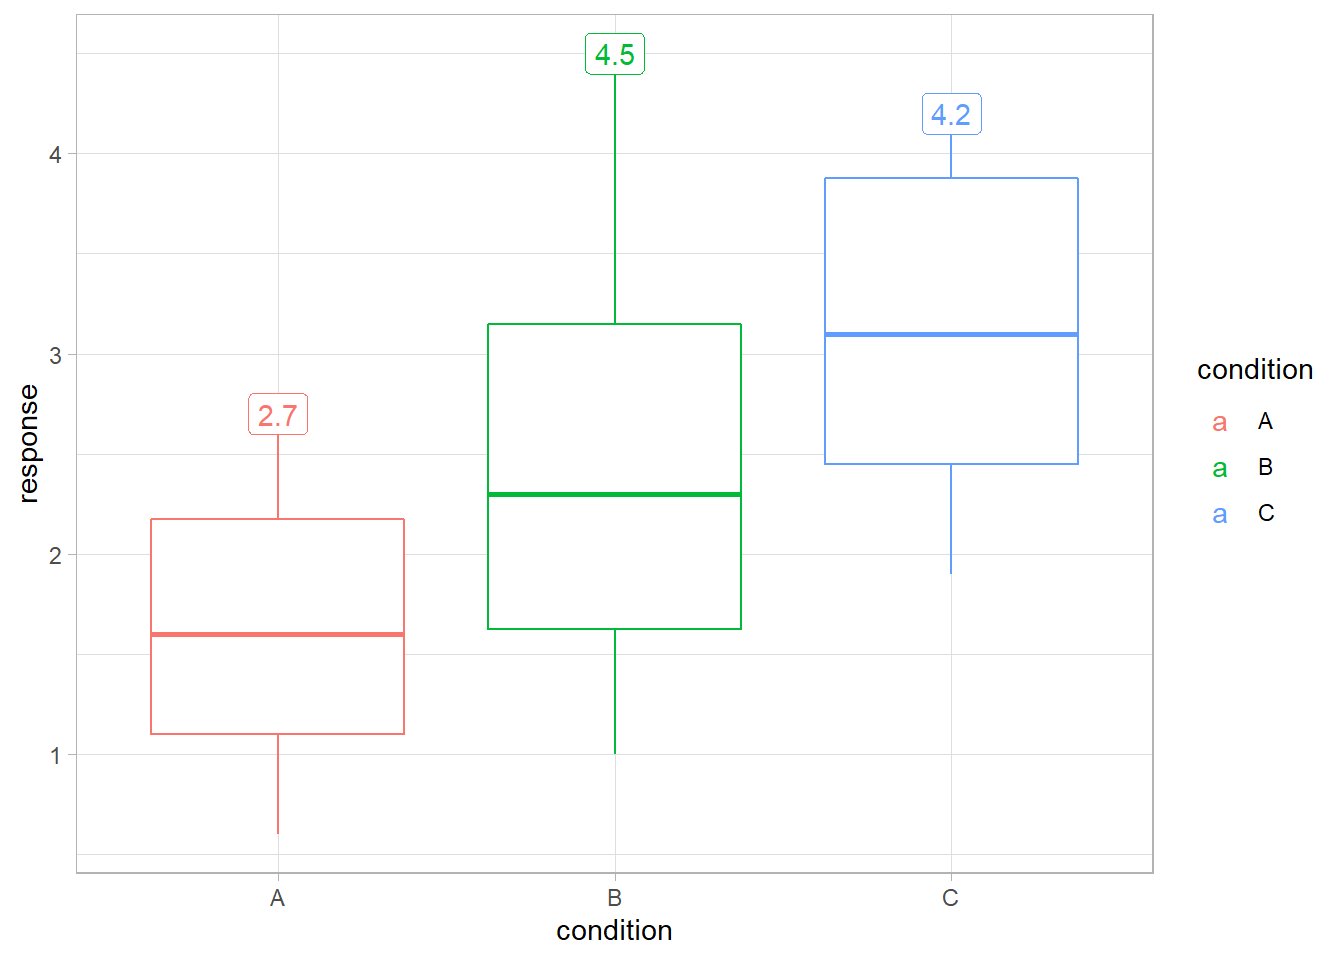
This allows us to replicate an example from June Choe’s talk in which the boxplot stat is reused with a label geometry instead of its normal boxplot geometry.
In ggplot2, this requires using after_stat() to reassign the y
aesthetic after stat_boxplot() does its computation:
df |>
  ggplot(aes(x = condition, y = response, color = condition)) +
  geom_boxplot() +
  geom_label(
    stat = "boxplot",
    aes(y = stage(response, after_stat = ymax), label = after_stat(ymax))
  )
This requires using the ggplot2::stage() and ggplot2::after_stat()
functions. As June Choe pointed out in his ggtrace talk, the flow from
plot data to stat transformation to geom aesthetics is written somewhat
out-of-order inside the call to aes().
In ggbuilder, we can write this data flow in order by piping a
stat_() into a geom_(), and specifying the aesthetics associated
with each:
df |>
  ggplot(aes(x = condition, y = response, color = condition)) +
  geom_boxplot() +
  stat_("boxplot", aes(y = response)) |>
    geom_("label", aes(y = ymax, label = ymax))
Under the hood, {ggbuilder} translates this into the appropriate calls
to stage() in order to build the geom.
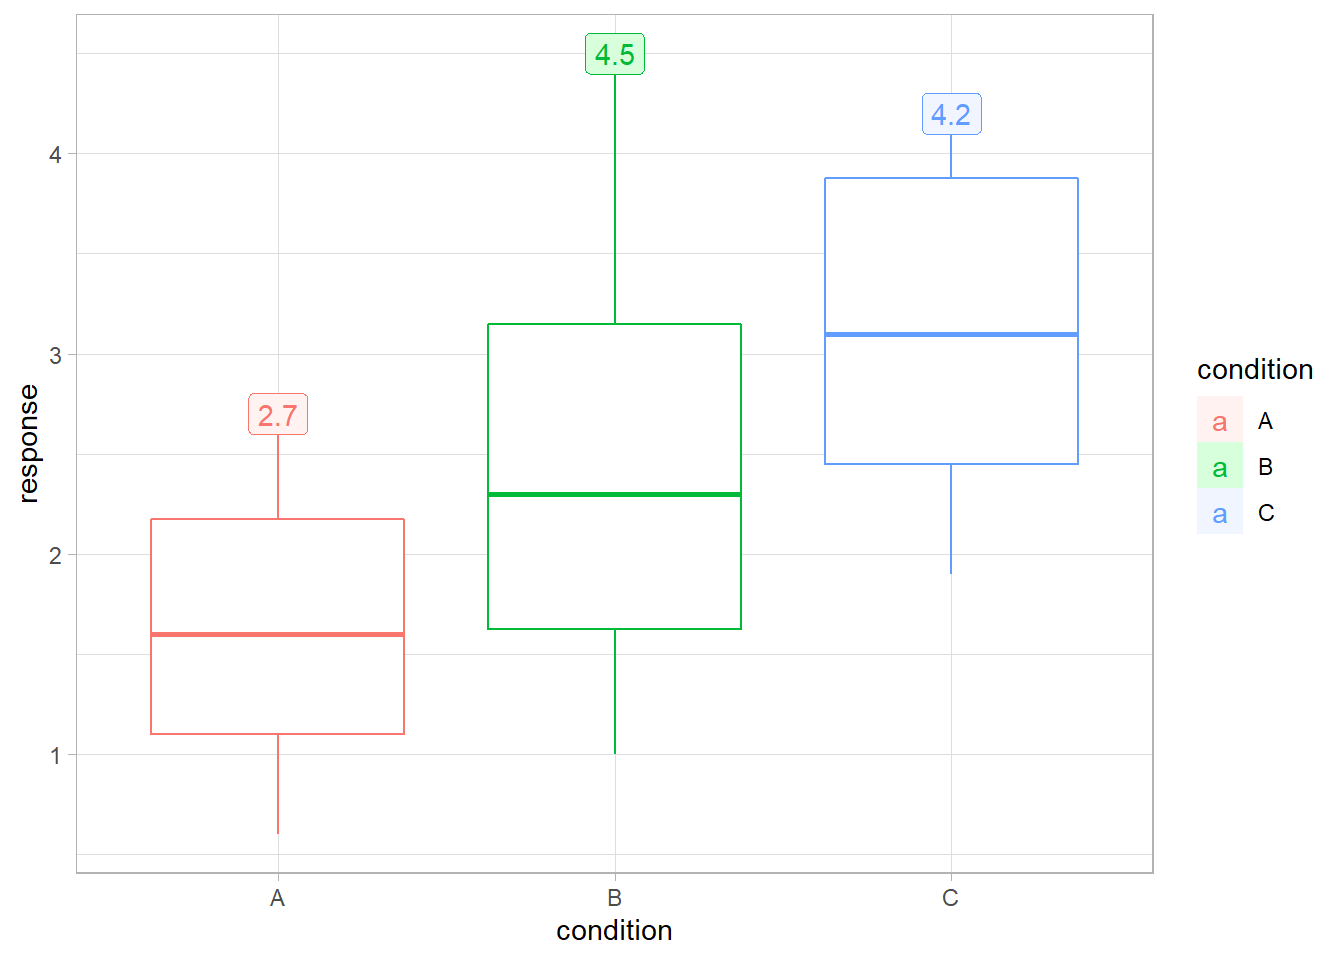
{ggbuilder} also allows us to do the equivalent of
ggplot2::after_scale() by piping a layer specification into remap().
This will apply changes to aesthetics after scales have been applied:
df |>
  ggplot(aes(x = condition, y = response, color = condition)) +
  geom_boxplot() +
  stat_("boxplot", aes(y = response)) |>
    geom_("label", aes(y = ymax, label = ymax)) |>
    remap(aes(fill = colorspace::lighten(color, 0.9)))
#> Warning: Duplicated aesthetics after name standardisation: NA
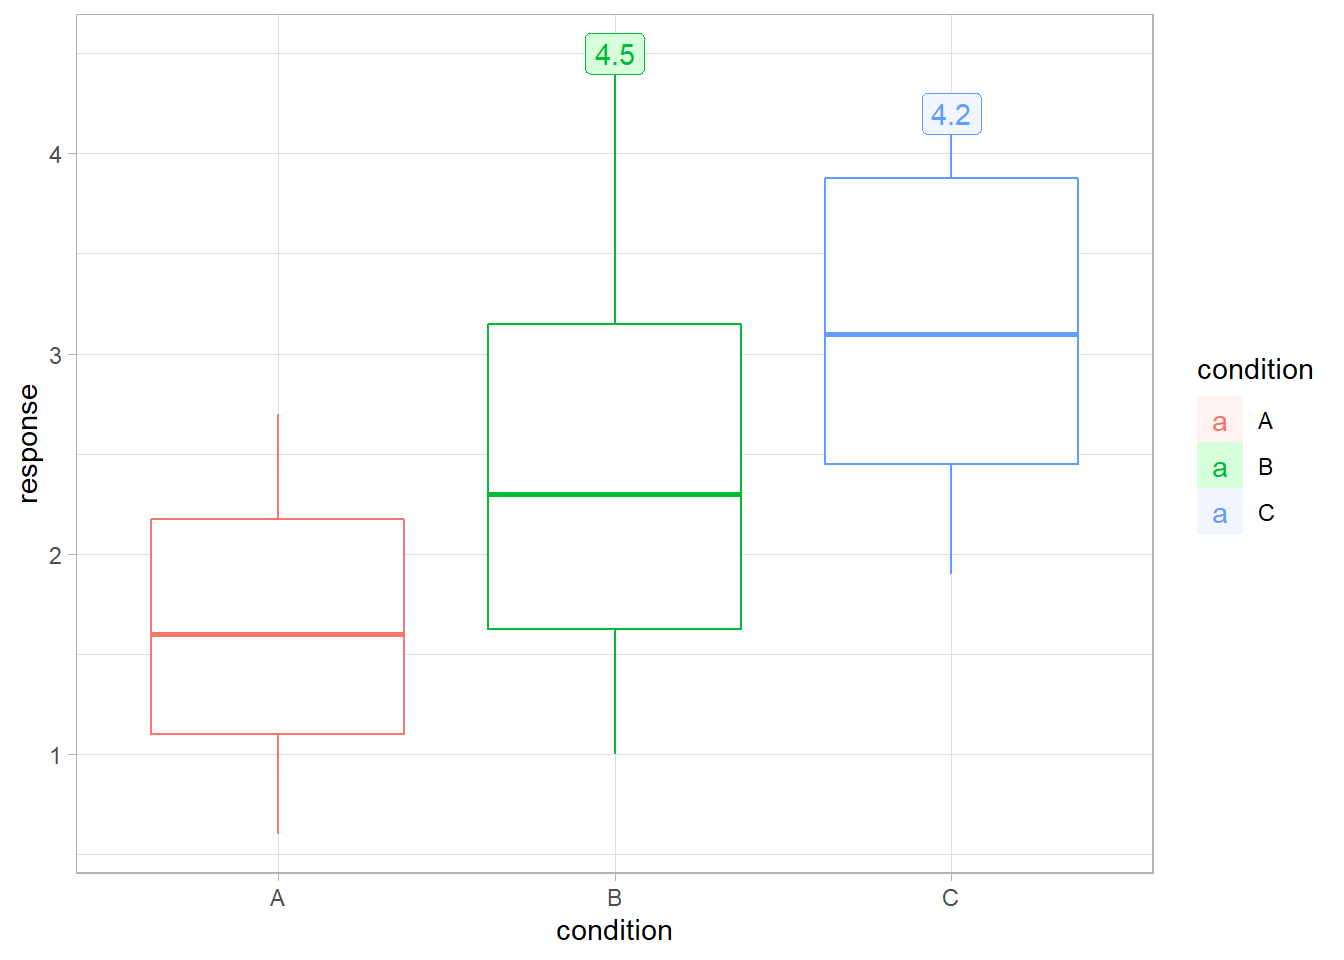
#> Duplicated aesthetics after name standardisation: NAWe can also modify the input data by passing a new data frame (or a
function that modifies a data frame) to the plot_data() function at
the top of a layer specification pipe:
df |>
  ggplot(aes(x = condition, y = response, color = condition)) +
  geom_boxplot() +
  plot_data(\(x) filter(x, condition %in% c("B", "C"))) |>
    stat_("boxplot", aes(y = response)) |>
    geom_("label", aes(y = ymax, label = ymax)) |>
    remap(aes(fill = colorspace::lighten(color, 0.9)))
#> Warning: Duplicated aesthetics after name standardisation: NA
#> Duplicated aesthetics after name standardisation: NA
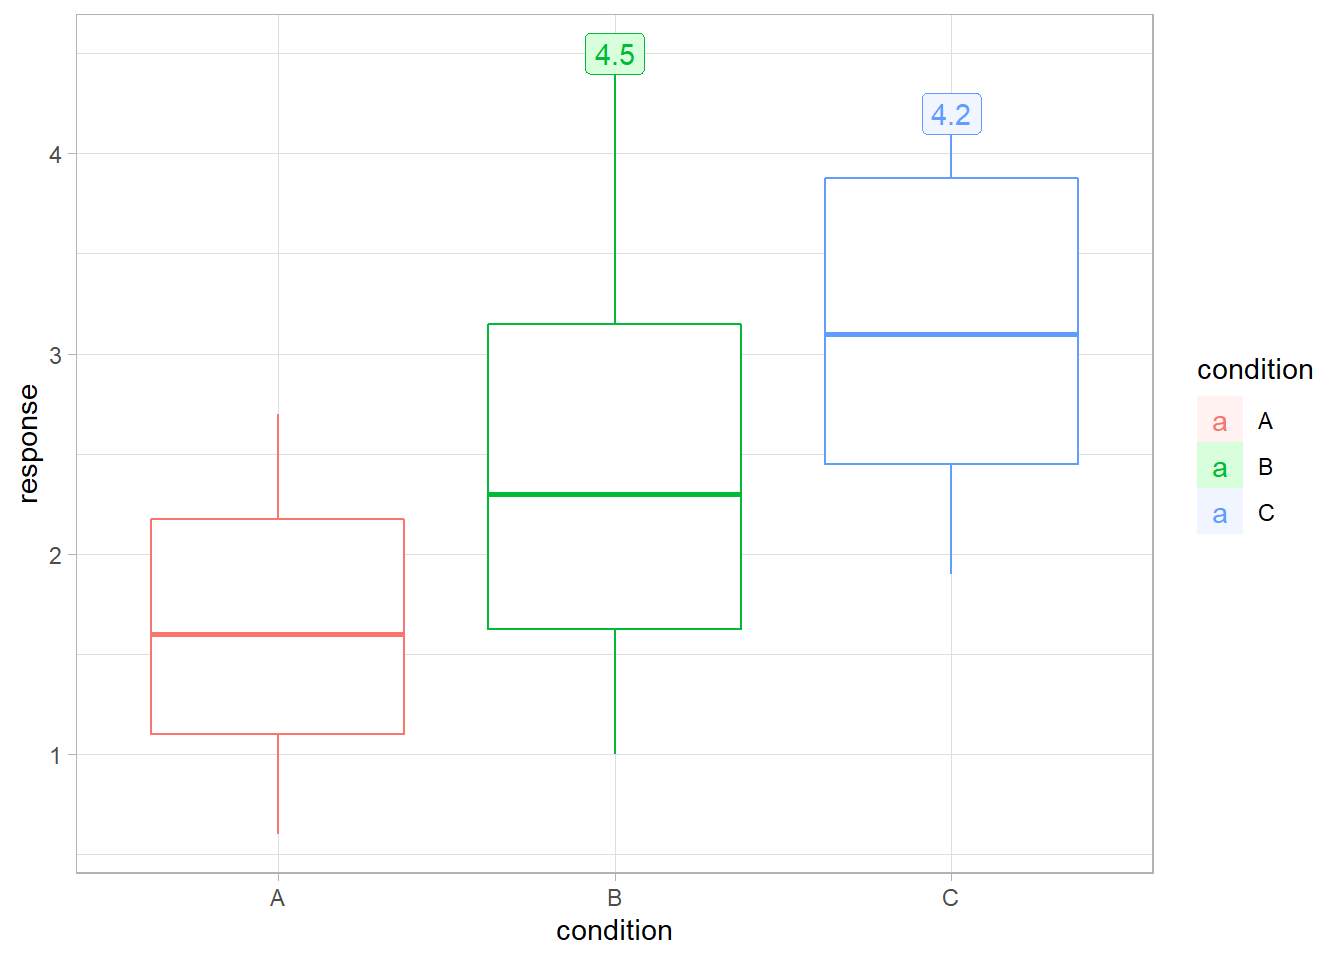
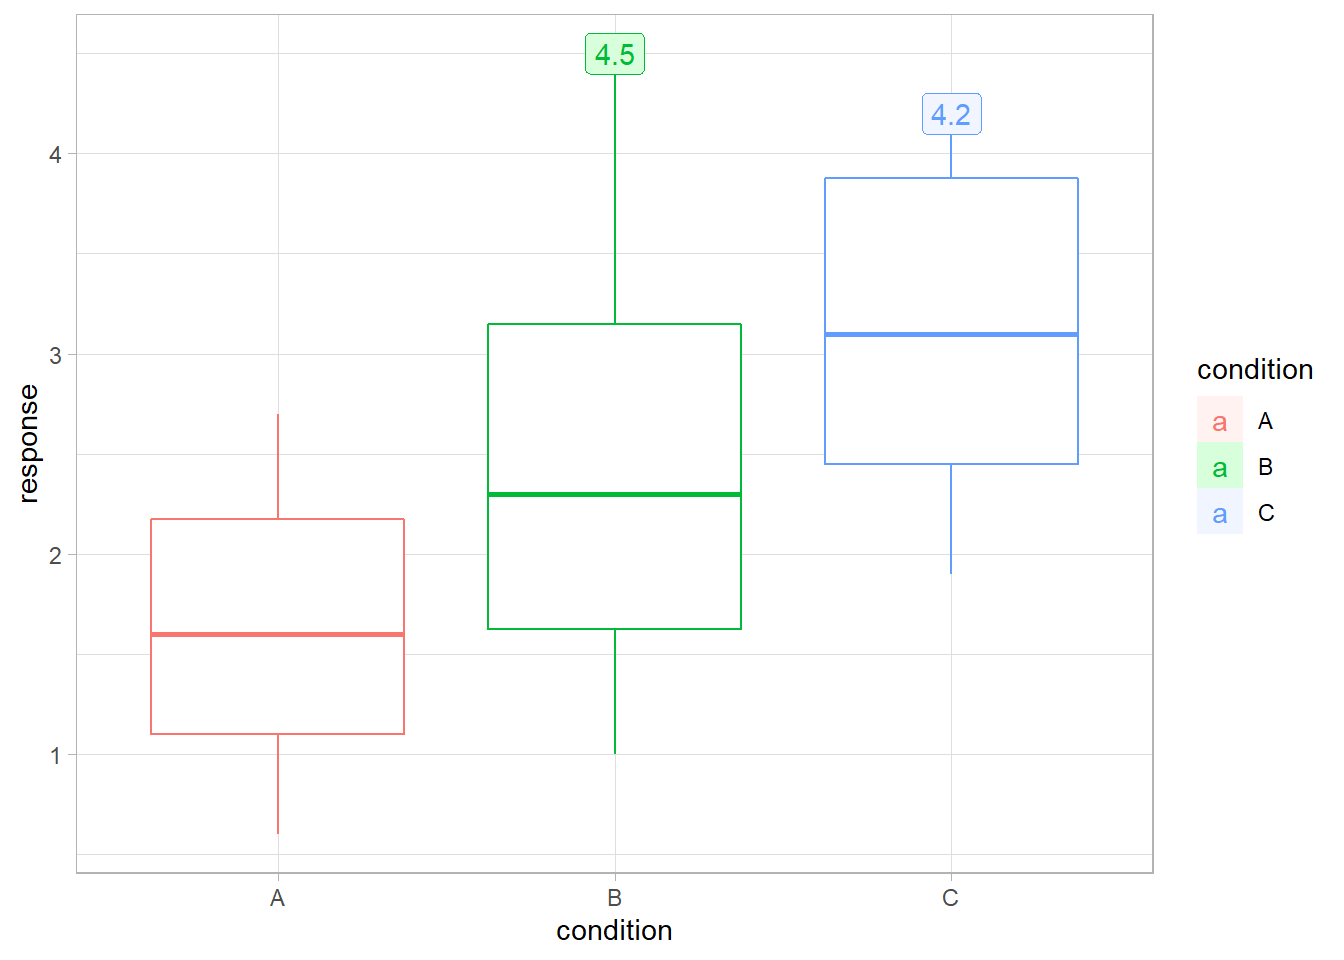
{ggbuilder} also provides implementations of {dplyr} and {tidyr} verbs
for plot_data(), so you can pipe plot_data() into those functions
instead of awkwardly passing them as an argument wrapped in an anonymous
function (like above):
df |>
  ggplot(aes(x = condition, y = response, color = condition)) +
  geom_boxplot() +
  plot_data() |>
    filter(condition %in% c("B", "C")) |>
    stat_("boxplot", aes(y = response)) |>
    geom_("label", aes(y = ymax, label = ymax)) |>
    remap(aes(fill = colorspace::lighten(color, 0.9)))
#> Warning: Duplicated aesthetics after name standardisation: NA
#> Duplicated aesthetics after name standardisation: NA
In fact, we could do the transformations ourselves, which may more clearly communiate our intent:
df |>
  ggplot(aes(x = condition, y = response, color = condition)) +
  geom_boxplot() +
  plot_data() |>
    filter(condition %in% c("B", "C")) |>
    group_by(condition) |>
    slice_max(response) |>
    geom_("label", aes(label = response)) |>
remap(aes(fill = colorspace::lighten(color, 0.9)))This package is very experimental! Feedback/issues are welcome. Not sure if this will ever go CRAN-wards, but maybe if it solidifies in the future :).
