Implement a D3-based tool that computes color histograms in a specific region of an image. The tool should allow computing values for RGB color space. Details are in Google Docs.
Open the solution in your browser.
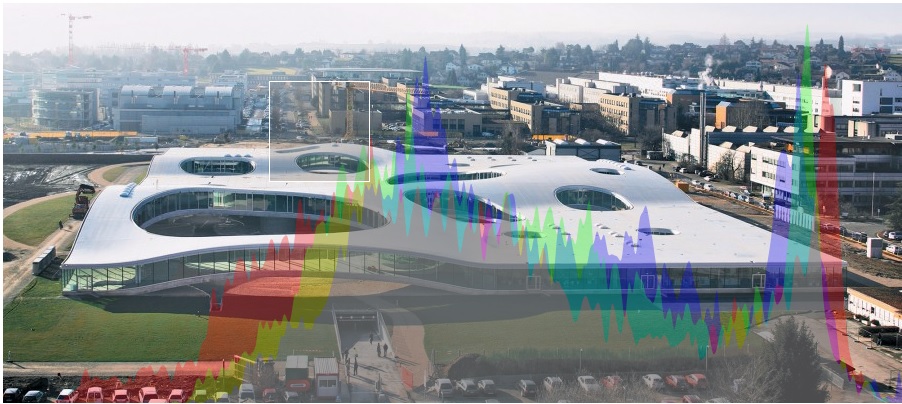
Data visualization course TA. Colorspaces, brushes, and histograms. Solution.
Implement a D3-based tool that computes color histograms in a specific region of an image. The tool should allow computing values for RGB color space. Details are in Google Docs.
Open the solution in your browser.
Data visualization course TA. Colorspaces, brushes, and histograms. Solution.