- Mental Wellness Index (MWI)
- Set Up MWI and Create Your Own MWI
- Using MWI Data
- Technical Set Up (only useful for contributors)
- Contact and Attribution
To view the Mental Wellness Index Tool, please see https://sjp.mitre.org/mwi. For more information about the Mental Wellness Index, see below or view the insight here.
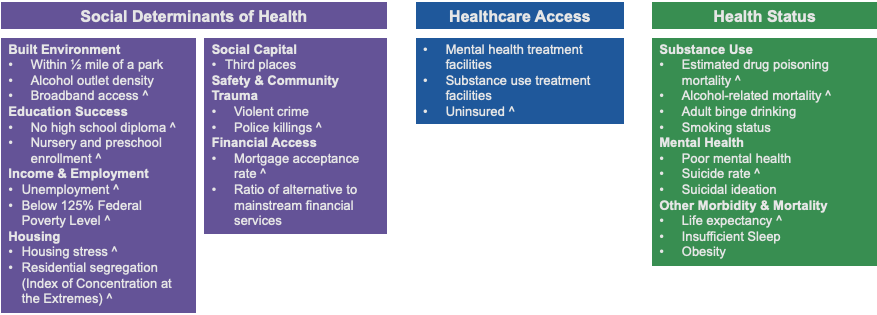
The Mental Wellness Index is a framework and dashboard tool that provides a picture of community-level mental wellness for each zip code* in the nation. The MWI is comprised of 28 measures from 3 domains: Social Determinants of Health, Healthcare Access, and Health Status. Structural Racism and Community & Cultural Assets are woven around and throughout the domains of the MWI itself, reflecting their influence throughout the measure framework.
The intent of the Mental Wellness Index is to provide a snapshot of a community's mental wellness so that community leaders, public health officials, and funding entities can understand how they might best direct mental health support to build on a particular community's assets and fill in its gaps.
*ZIP Code Tabulation Area (ZCTA)
The MWI creates a score for each zip code between 0 and 100, such that:
-
higher values indicate more assets that support community mental wellness
-
lower values indicate more obstacles that challenge community mental wellness
^ indicates measures that are race stratified
The MWI was developed with the mental health status of Black Americans in mind. We selected Black Americans as a priority population in order to center at the margins and avoid creating an index that is focused to the 'average community.' We believe that focusing on Black Americans in this way allows all groups experiencing disparities to benefit because none of us are well until all of us are well. We also recognize the need to identify, recognize, and adapt the MWI for additional priority populations.
Data has been updated to most recently available as of January 24, 2023. If you would like to use previously released versions of the MWI, see Releases.
To set up and simply run the Mental Wellness Index Tool, follow instructions 1 - 8.
To create your own Mental Wellness Index, you can follow the rest of the instructions to run the Mental Wellness Index Tool on your local computer. Follow instructions 8+ below to create your own MWI for your community below by adjusting weights and/or adding your own data and metadata.
-
Download free versions of R and RStudio. Download a modern browser (Firefox, Chrome, Edge, etc.) and make that your default browser if you haven't already.
-
Go to the Mental Wellness Index GitHub page and download the repository by clicking "Code" in the top right corner, then clicking "Download ZIP" from the dropdown menu. This should download a ZIP file of the MWI repository into your downloads folder, called "hse-mwi-main.zip".
-
Unzip "hse-mwi-main.zip".
-
In the unzipped folder, open "app.R" in RStudio. This should open RStudio and the "app.R" script in the top left hand corner of the application.
-
In the console window, which is in the bottom left hand corner, enter the following line and answer "yes" to all prompts in the console as you install these packages:
- install.packages('readxl', 'writexl', 'htmltools', 'shiny', 'tigris', 'leaflet', 'RColorBrewer', 'sf', 'plotly', 'ggbeeswarm', 'shinyWidgets', 'sass', 'shinycssloaders', 'shinyBS', 'DT', 'dplyr')
-
In "app.R", navigate to line 11, which should say "app_local <- FALSE". Change FALSE to TRUE.
-
In the top right hand corner of the "app.R" window, you should see "Run App". Click the small downward arrow to the right of that and click "Run External". Then click "Run App".
-
After a delay (this will be slow the first time, then quicker after that), the Mental Wellness Index Tool should open in your browser. Click on the "Create Your Own MWI" tab and follow the remaining steps to create your own MWI.
-
If you are only adjusting weights or subsetting to specific ZIP Codes for included data, skip the next step. This can also be done on the website here.
-
Put each of your datasets in a CSV (comma separated value) format, with one column corresponding to the geographical ID of the data, a column corresponding to the numerator of the data, and another column corresponding to the denominator (if needed).
- Accepted geographical ID types are always numeric and include the following:
- ZCTA: 5 digit ZCTA (example: 35406)
- County: 5 digit County FIPS Code (2 digits state code and 3 digit county code, example: 01001)
- ZIP Code: US Postal Service ZIP Code (example: 35051)
- Census Tract: 11 digit Census Tract FIPS Code (2 digits state code, 3 digit county code, and 6 digit tract code, example: 01001020100)
- If a denominator column is provided, the final input to the MWI will be the numerator divided by the denominator, multiplied by the scaling number (specified in the metadata file, see next step).
- Numerators and denominators must be numeric columns.
- Missing data should have cells left blank.
- If race stratified, there should be two columns: one ending in '_pop' corresponding to the overall population measure, and one ending in '_black' corresponding to the black populations measure. In the Metadata.xlsx file edit, that row's 'Preprocessed' column should be set to TRUE.
- Download Metadata.xlsx with the button below. If adding custom data, add a row and fill in information for each measure you want to add to the Mental Wellness Index. Descriptions for each column can be found in the 'Column Descriptions' sheet of the Metadata.xlsx. Note that all column names, with the exception of 'denominator', must be filled out.
- If you have multiple measures in one file, add a row for each measure and its qualities, but specify the same file name.
- If you would like to remove a measure in your MWI, either delete the measure row or set its weight to 0.
- If you would only like to adjust weights, change only the weight column to the desired values. Note that penalties for race stratifications and geographic granularity are still applied and total weights are scaled to sum to 100.
-
Put your data (if using) and the updated Metadata.xlsx file in a ZIP file (.zip).
-
Upload your ZIP file and click 'Create Custom MWI' below. This will take some time, depending on the amount of measures included.
-
Once the custom MWI creation is complete, click 'Download Custom MWI' to download an .RData file with all of the needed information to view your MWI in this tool. Note: if you navigate away from this page, all processing and data will be lost! Nothing is stored within this application.
-
To view your MWI, click the 'Custom MWI Upload' box under 'Explore States' or 'Explore ZIP Codes' and upload the downloaded '.RData' file.
If you would like to use the MWI or its processed measures or data, see the "Data" and "Documentation" folders for more information. Each folder in "Data" has a README detailing the included files. All data, with the exception of the Metadata file, is in CSV format.
Folders in "Data" are as follows:
- Resources: contains files for processing data and referencing geography crosswalks.
- Preprocessed: contains preprocessed data for all measures in the format the MWI pipeline requires: one column to indicate geographical identifier, then one for the numerical value of each measure.
- Cleaned: contains Mental Wellness Index results and processing pipeline results.
Note: this section is primarily for contributors.
Sync Microsoft Teams BHN Score Creation folder into your local The MITRE Corporation (One-Drive) folder
Measure Tracking document located in Teams > BHN Score > Measure-Tracking.xslx
Refer to and update this document when additional measures are finalized.
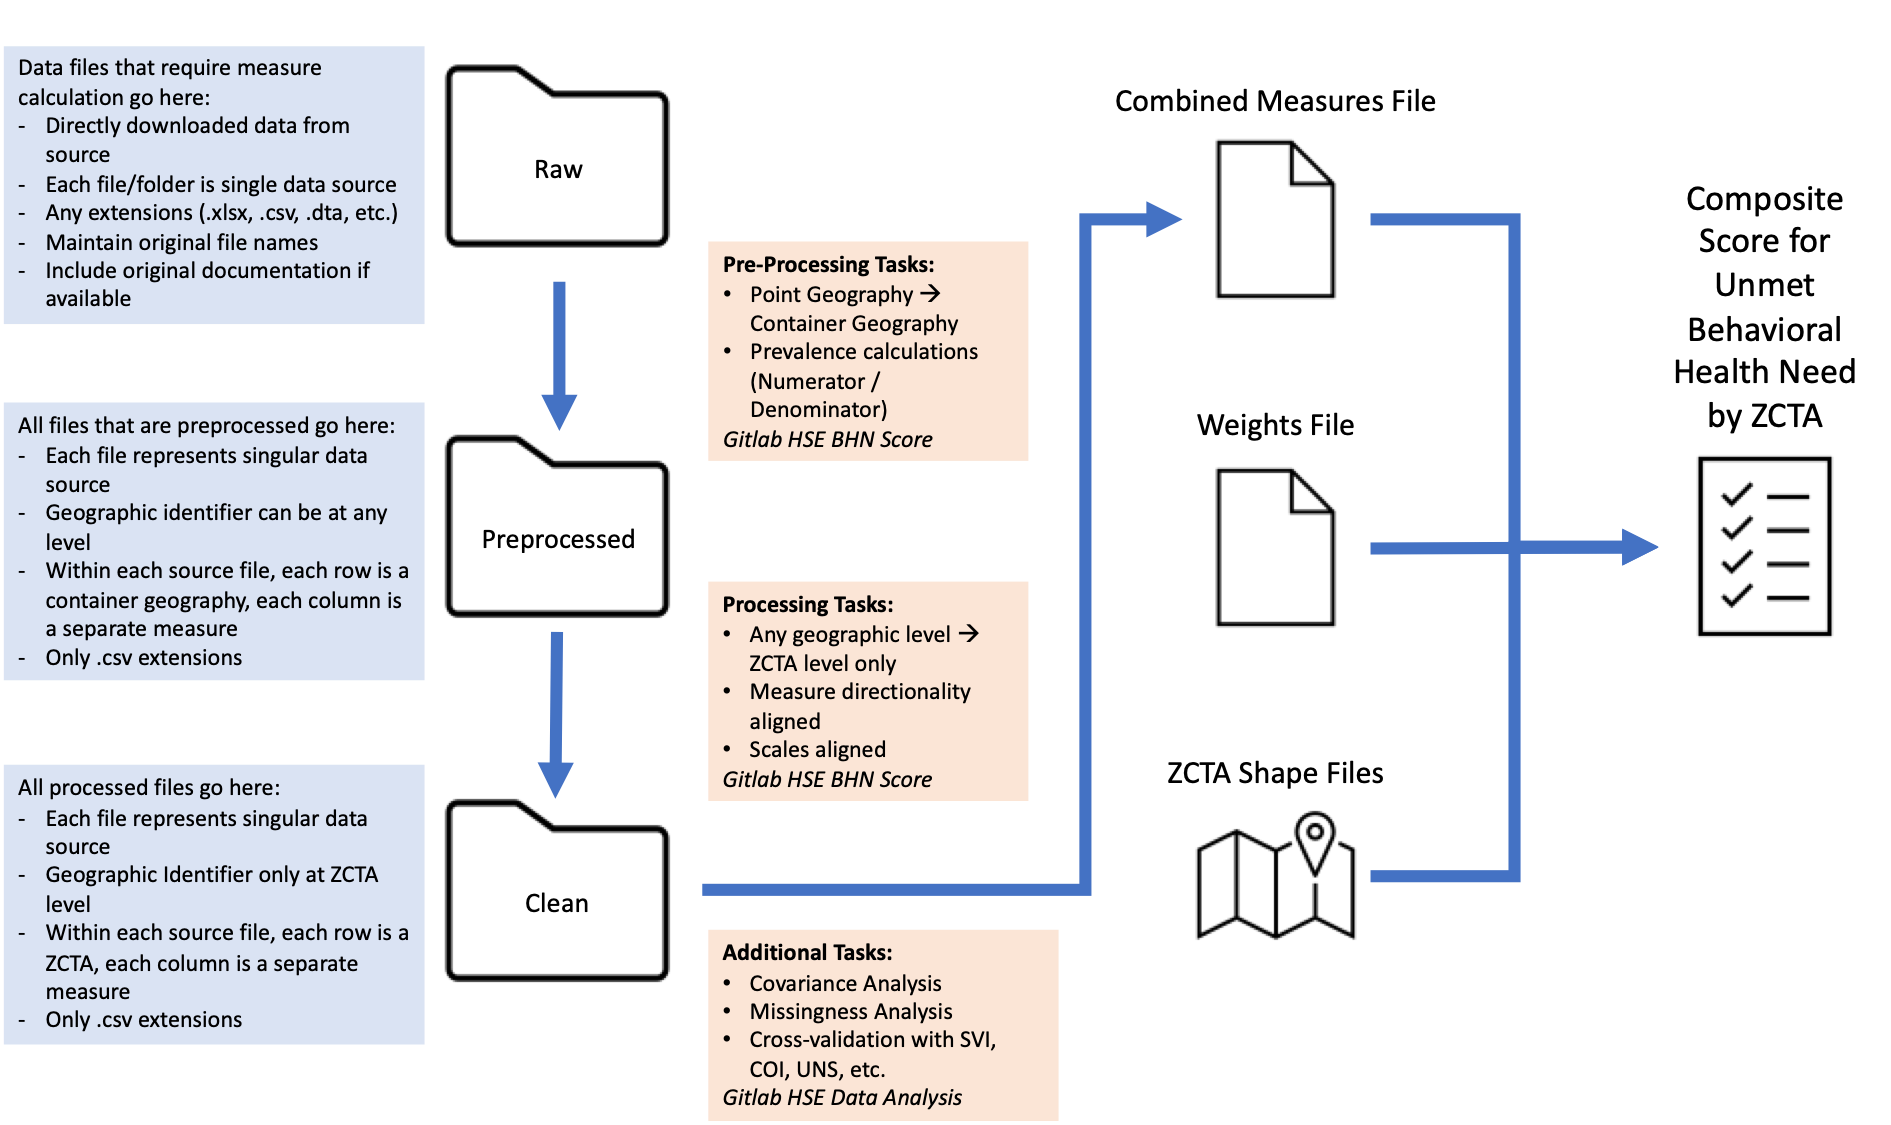
Add data pulled from an API or directly downloaded from a website will fall into one of the two folders:
-
Teams>BHN Score>Data>Raw-
if any measure calculation needs to be completed (i.e. point geography to container geography, prevalence calculations, etc.)
-
file extension is can also be .xlsx, .csv, .dta, etc
-
-
Teams>BHN Score>Data>Preprocessed-
if data falls into a format where each row is a geographic container (i.e. Census Tract, County, ZIP Code, etc.)
-
file extension is .csv only
-
Note: For any data pulled from an API (tidycensus, etc.), perform any pre-processing tasks and write data directly to
Preprocessedfolder.
-
When pulling data, make sure to fill out relevant columns in the Measure-Tracking.xlsx and / or Metadata.xlsx files.
Measure Registration document in Teams > BHN Score >Data > Metadata.xslx . This document provides information required for batch processing / batch analysis from Pre-Processed data to Clean data.
This file contains information on all pre-processed measures and informs any additional transformations that need to occur between pre-processing and cleaned data, including:
-
Any geographic level -> ZCTA level only
-
Measure directionality aligned (higher values indicate higher need)
-
Scaling aligned (fractions to percents 0.1 -> 10(%), prevalence adjustments (per 1000 people), etc.)
Once data is cleaned, they will be merged into the Combined Measures file. There will be two versions:
-
Original combined measures file:
Teams>BHN Score>Data>Cleaned>HSE_ZCTA_Converted_Measures.csv -
Percentile Scaled combined measures file:
Teams>BHN Score>Data>Cleaned>HSE_ZCTA_Percentile_Ranked_Measures.csv
In addition, information about data (amount missing, number of nonmissing rows, etc.) is generated and appears in: Teams > BHN Score >Data > Cleaned > HSE_BHN_Data_Information.csv.
With Combined Measure files, we will perform the following analyses:
-
Covariance analysis (flagging and managing variable sets with high multi-collinearity)
-
Missingness analysis (identifying measures with high multiple missing values, identifying ZCTAs with multiple missing measures)
-
Cross-Validation with other composite measures (COI, UNS, CHR, SVI, etc.)
Measure documentation can be found in Teams > BHN Score >Documentation folder.
We will create 3 sets of weights files:
-
Parsimonious weighting (All equal weights)
-
Child Opportunity Index weighting determination method
-
County Health Rankings weighting
Final scores for each ZCTA will be created by combining the weights and combined measures file. Measures and measure weights are multiplied together, summed for each ZCTA, and then re-scaled from 0 to 100. Scores appear (with percentile ranked measures) in Teams > BHN Score >Data > Cleaned:
-
Total Population Score:
HSE_BHN_ZCTA_Score_Black.csv -
Black Population Score:
HSE_BHN_ZCTA_Score_Population.csv
For any questions or concerns, please contact socialjustice@mitre.org.
Approved for Public Release; Distribution Unlimited. Public Release Case Number 21-3708. ©2021 The MITRE Corporation. ALL RIGHTS RESERVED.
.png?raw=true)

