![]()
S3 benchmarking tool.
Download Binary Releases for various platforms.
Warp require minimum version is go1.22, please ensure you have compatible version for this build.
You can follow easy step below to build project
- Clone project
git clone https://github.com/minio/warp.git
- Change directory and build
cd warp && go build
- To run a test, please run
./warp [options]
Warp can be configured either using commandline parameters or environment variables.
The S3 server to use can be specified on the commandline using --host, --access-key,
--secret-key and optionally --tls and --region to specify TLS and a custom region.
It is also possible to set the same parameters using the WARP_HOST, WARP_ACCESS_KEY,
WARP_SECRET_KEY, WARP_REGION and WARP_TLS environment variables.
The credentials must be able to create, delete and list buckets and upload files and perform the operation requested.
By default operations are performed on a bucket called warp-benchmark-bucket.
This can be changed using the --bucket parameter.
Do however note that the bucket will be completely cleaned before and after each run,
so it should not contain any data.
If you are running TLS,
you can enable server-side-encryption
of objects using --encrypt. A random key will be generated and used for objects.
To use SSE-S3 encryption use the --sse-s3-encrypt flag.
If your server is incompatible with AWS v4 signatures the older v2 signatures can be used with --signature=S3V2.
warp command [options]
Example running a mixed type benchmark against 8 servers named s3-server-1 to s3-server-8
on port 9000 with the provided keys:
warp mixed --host=s3-server{1...8}:9000 --access-key=minio --secret-key=minio123 --autoterm
This will run the benchmark for up to 5 minutes and print the results.
All benchmarks operate concurrently. By default, 20 operations will run concurrently.
This can however also be tweaked using the --concurrent parameter.
Tweaking concurrency can have an impact on performance, especially if latency to the server is tested. Most benchmarks will also use different prefixes for each "thread" running.
By default all benchmarks save all request details to a file named warp-operation-yyyy-mm-dd[hhmmss]-xxxx.csv.zst.
A custom file name can be specified using the --benchdata parameter.
The raw data is zstandard compressed CSV data.
Multiple S3 hosts can be specified as comma-separated values, for instance
--host=10.0.0.1:9000,10.0.0.2:9000 will switch between the specified servers.
Alternatively numerical ranges can be specified using --host=10.0.0.{1...10}:9000 which will add
10.0.0.1 through 10.0.0.10. This syntax can be used for any part of the host name and port.
A file with newline separated hosts can also be specified using file: prefix and a file name.
For distributed tests the file will be read locally and sent to each client.
By default a host is chosen between the hosts that have the least number of requests running
and with the longest time since the last request finished. This will ensure that in cases where
hosts operate at different speeds that the fastest servers will get the most requests.
It is possible to choose a simple round-robin algorithm by using the --host-select=roundrobin parameter.
If there is only one host this parameter has no effect.
When benchmarks are done per host averages will be printed out.
For further details, the --analyze.v parameter can also be used.
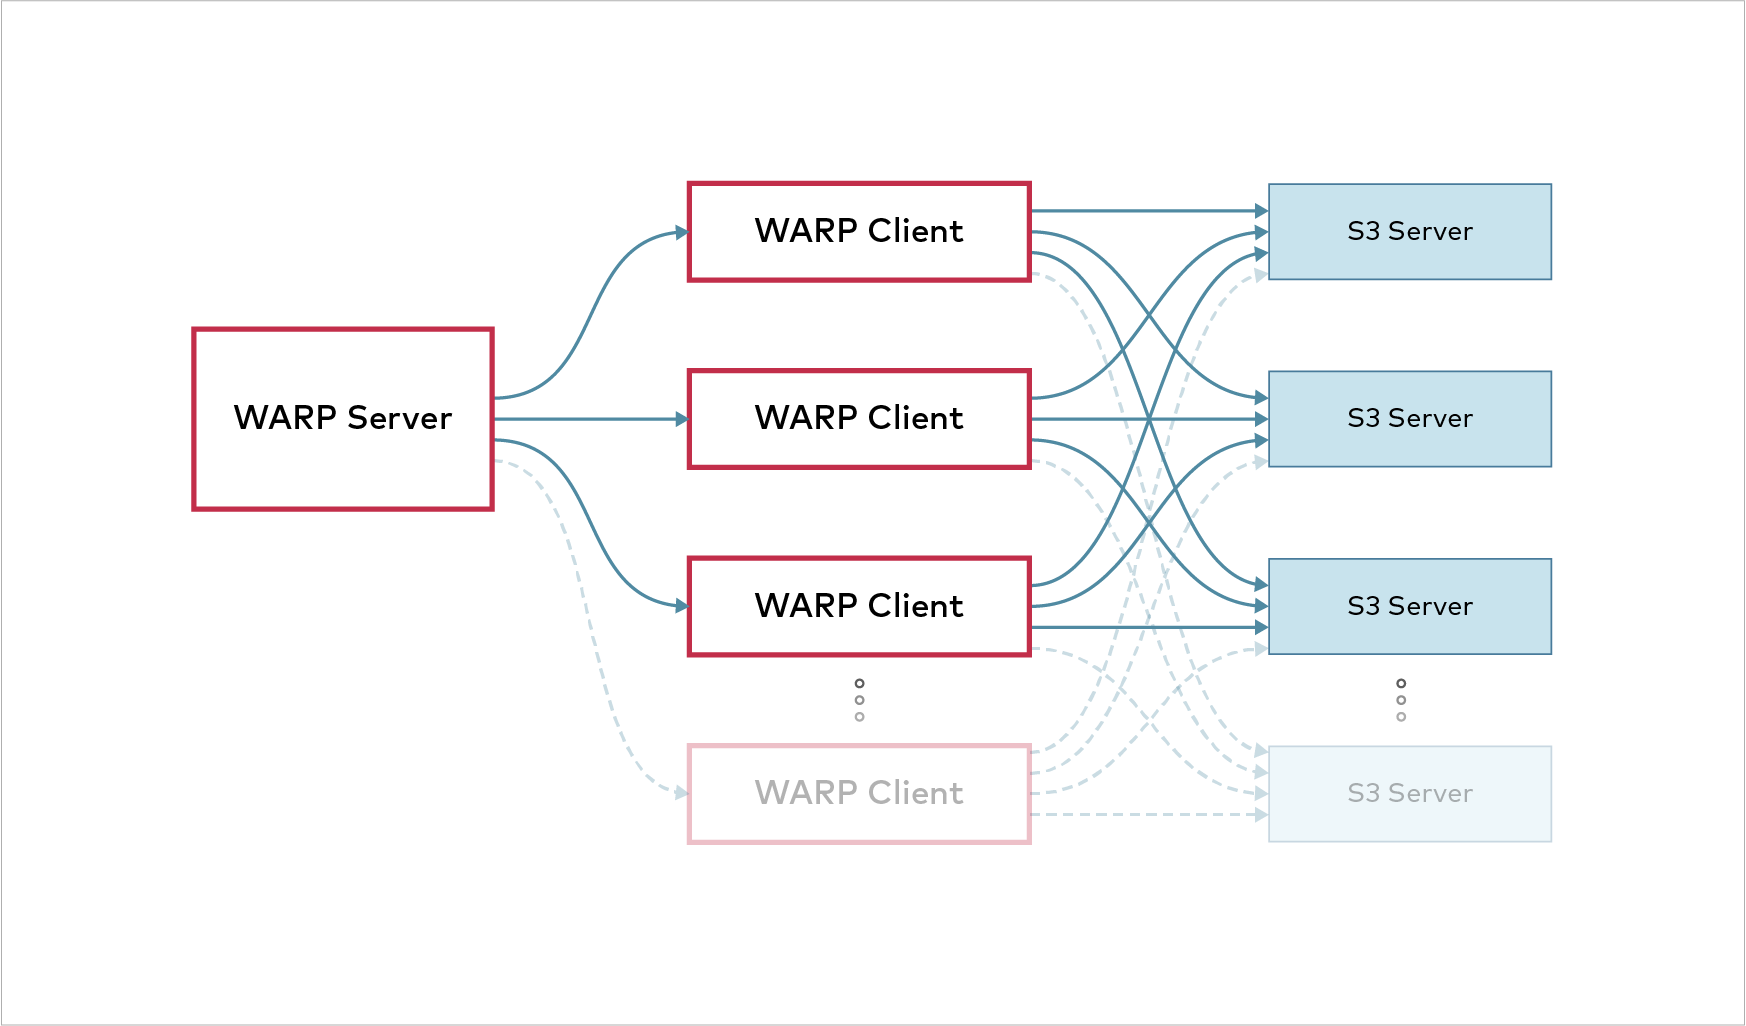
It is possible to coordinate several warp instances automatically. This can be useful for testing performance of a cluster from several clients at once.
For reliable benchmarks, clients should have synchronized clocks. Warp checks whether clocks are within one second of the server, but ideally, clocks should be synchronized with NTP or a similar service.
To use Kubernetes see Running warp on kubernetes.
WARNING: Never run warp clients on a publicly exposed port. Clients have the potential to DDOS any service.
Clients are started with
warp client [listenaddress:port]
warp client Only accepts an optional host/ip to listen on, but otherwise no specific parameters.
By default warp will listen on 127.0.0.1:7761.
Only one server can be connected at the time. However, when a benchmark is done, the client can immediately run another one with different parameters.
There will be a version check to ensure that clients are compatible with the server, but it is always recommended to keep warp versions the same.
Any benchmark can be run in server mode. When warp is invoked as a server no actual benchmarking will be done on the server. Each client will execute the benchmark.
The server will coordinate the benchmark runs and make sure they are run correctly.
When the benchmark has finished, the combined benchmark info will be collected, merged and saved/displayed. Each client will also save its own data locally.
Enabling server mode is done by adding --warp-client=client-{1...10}:7761
or a comma separated list of warp client hosts.
Finally, a file with newline separated hosts can also be specified using file: prefix and a file name.
If no host port is specified the default is added.
Example:
warp get --duration=3m --warp-client=client-{1...10} --host=minio-server-{1...16} --access-key=minio --secret-key=minio123
Note that parameters apply to each client.
So if --concurrent=8 is specified each client will run with 8 concurrent operations.
If a warp server is unable to connect to a client the entire benchmark is aborted.
If the warp server looses connection to a client during a benchmark run an error will be displayed and the server will attempt to reconnect. If the server is unable to reconnect, the benchmark will continue with the remaining clients.
While it is highly recommended to use the automatic distributed benchmarking warp can also be run manually on several machines at once.
When running benchmarks on several clients, it is possible to synchronize
their start time using the --syncstart parameter.
The time format is 'hh:mm' where hours are specified in 24h format,
and parsed as local computer time.
Using this will make it more reliable to merge benchmarks from the clients for total result. This will combine the data as if it was run on the same client. Only the time segments that was actually overlapping will be considered.
When running benchmarks on several clients it is likely a good idea to specify the --noclear parameter
so clients don't accidentally delete each others data on startup.
By default warp uploads random data.
Most benchmarks use the --obj.size parameter to decide the size of objects to upload.
Different benchmark types will have different default values.
It is possible to randomize object sizes by specifying --obj.randsize
and files will have a "random" size up to --obj.size.
However, there are some things to consider "under the hood".
We use log2 to distribute objects sizes.
This means that objects will be distributed in equal number for each doubling of the size.
This means that obj.size/64 -> obj.size/32 will have the same number of objects as obj.size/2 -> obj.size.
Example of objects (horizontally) and their sizes, 100MB max:

To see segmented request statistics, use the --analyze.v parameter.
λ warp analyze --analyze.op=GET --analyze.v warp-get-2020-08-18[190338]-6Nha.csv.zst

Operation: GET (78188). Concurrency: 32.

Requests considered: 78123. Multiple sizes, average 1832860 bytes:

Request size 1 B -> 10 KiB. Requests - 10836:
 * Throughput: Average: 1534.6KiB/s, 50%: 1571.9KiB/s, 90%: 166.0KiB/s, 99%: 6.6KiB/s, Fastest: 9.7MiB/s, Slowest: 1124.8B/s
 * First Byte: Average: 3ms, Median: 2ms, Best: 1ms, Worst: 39ms

Request size 10KiB -> 1MiB. Requests - 38219:
 * Throughput: Average: 73.5MiB/s, 50%: 66.4MiB/s, 90%: 27.0MiB/s, 99%: 13.6MiB/s, Fastest: 397.6MiB/s, Slowest: 3.1MiB/s
 * First Byte: Average: 3ms, Median: 2ms, Best: 1ms, Worst: 41ms

Request size 1MiB -> 10MiB. Requests - 33091:
 * Throughput: Average: 162.1MiB/s, 50%: 159.4MiB/s, 90%: 114.3MiB/s, 99%: 80.3MiB/s, Fastest: 505.4MiB/s, Slowest: 22.4MiB/s
 * First Byte: Average: 3ms, Median: 2ms, Best: 1ms, Worst: 40ms

Throughput:
* Average: 4557.04 MiB/s, 2604.96 obj/s (29.901s, starting 19:03:41 CEST)

Throughput, split into 29 x 1s:
 * Fastest: 4812.4MiB/s, 2711.62 obj/s (1s, starting 19:03:41 CEST)
 * 50% Median: 4602.6MiB/s, 2740.27 obj/s (1s, starting 19:03:56 CEST)
 * Slowest: 4287.0MiB/s, 2399.84 obj/s (1s, starting 19:03:53 CEST)
The average object size will be close to --obj.size multiplied by 0.179151.
To get a value for --obj.size multiply the desired average object size by 5.582 to get a maximum value.
Adding --autoterm parameter will enable automatic termination when results are considered stable.
To detect a stable setup, warp continuously downsample the current data to
25 data points stretched over the current timeframe.
For a benchmark to be considered "stable", the last 7 of 25 data points must be within a specified percentage. Looking at the throughput over time, it could look like this:

The red frame shows the window used to evaluate stability.
The height of the box is determined by the threshold percentage of the current speed.
This percentage is user configurable through --autoterm.pct, default 7.5%.
The metric used for this is either MiB/s or obj/s depending on the benchmark type.
To make sure there is a good sample data, a minimum duration of the 7 of 25 samples is set.
This is configurable --autoterm.dur. This specifies the minimum time length the benchmark must have been stable.
If the benchmark doesn't autoterminate it will continue until the duration is reached. This cannot be used when benchmarks are running remotely.
A permanent 'drift' in throughput will prevent automatic termination, if the drift is more than the specified percentage. This is by design since this should be recorded.
When using automatic termination be aware that you should not compare average speeds, since the length of the benchmark runs will likely be different. Instead 50% medians are a much better metrics.
Mixed mode benchmark will test several operation types at once.
The benchmark will upload --objects objects of size --obj.size and use these objects as a pool for the benchmark.
As new objects are uploaded/deleted they are added/removed from the pool.
The distribution of operations can be adjusted with the --get-distrib, --stat-distrib,
--put-distrib and --delete-distrib parameters.
The final distribution will be determined by the fraction of each value of the total.
Note that put-distrib must be bigger or equal to --delete-distrib to not eventually run out of objects.
To disable a type, set its distribution to 0.
Example:
λ warp mixed --duration=1m
[...]
Mixed operations.

Operation: GET
 * 632.28 MiB/s, 354.78 obj/s (59.993s, starting 07:44:05 PST) (45.0% of operations)

Operation: STAT
 * 236.38 obj/s (59.966s, starting 07:44:05 PST) (30.0% of operations)

Operation: PUT
 * 206.11 MiB/s, 118.23 obj/s (59.994s, starting 07:44:05 PST) (15.0% of operations)

Operation: DELETE
 * 78.91 obj/s (59.927s, starting 07:44:05 PST) (10.0% of operations)
A similar benchmark is called versioned which operates on versioned objects.
Benchmarking get operations will attempt to download as many objects it can within --duration.
By default, --objects objects of size --obj.size are uploaded before doing the actual bench.
Objects will be uploaded with --concurrent different prefixes, except if --noprefix is specified.
Using --list-existing will list at most --objects from the bucket and download them instead
of uploading random objects (set it to 0 to use all object from the listing).
Listing is restricted to --prefix if it is set and recursive listing can be disabled by setting --list-flat
If versioned listing should be tested, it is possible by setting --versions=n (default 1),
which will add multiple versions of each object and request individual versions.
When downloading, objects are chosen randomly between all uploaded data and the benchmark
will attempt to run --concurrent concurrent downloads.
The analysis will include the upload stats as PUT operations and the GET operations.
Operation: GET
* Average: 94.10 MiB/s, 9866.97 obj/s

Throughput, split into 299 x 1s:
 * Fastest: 99.8MiB/s, 10468.54 obj/s
 * 50% Median: 94.4MiB/s, 9893.37 obj/s
 * Slowest: 69.4MiB/s, 7279.03 obj/s
The GET operations will contain the time until the first byte was received.
This can be accessed using the --analyze.v parameter.
It is possible to test speed of partial file requests using the --range option.
This will start reading each object at a random offset and read a random number of bytes.
Using this produces output similar to --obj.randsize - and they can even be combined.
Benchmarking put operations will upload objects of size --obj.size until --duration time has elapsed.
Objects will be uploaded with --concurrent different prefixes, except if --noprefix is specified.
Operation: PUT
* Average: 10.06 MiB/s, 1030.01 obj/s

Throughput, split into 59 x 1s:
 * Fastest: 11.3MiB/s, 1159.69 obj/s
 * 50% Median: 10.3MiB/s, 1059.06 obj/s
 * Slowest: 6.7MiB/s, 685.26 obj/s
It is possible by forcing md5 checksums on data by using the --md5 option.
Benchmarking delete operations will attempt to delete as many objects it can within --duration.
By default, --objects objects of size --obj.size are uploaded beforing doin the actual bench.
The delete operations are done in --batch objects per request in --concurrent concurrently running requests.
If there are no more objects left the benchmark will end.
Using --list-existing will list at most --objects from the bucket and delete them instead of
deleting random objects (set it to 0 to use all objects from the lsiting).
Listing is restricted to --prefix if it is set and recursive listing can be disabled by setting --list-flat.
The analysis will include the upload stats as PUT operations and the DELETE operations.
Operation: DELETE
* Average: 10.06 MiB/s, 1030.01 obj/s

Throughput, split into 59 x 1s:
 * Fastest: 11.3MiB/s, 1159.69 obj/s
 * 50% Median: 10.3MiB/s, 1059.06 obj/s
 * Slowest: 6.7MiB/s, 685.26 obj/s
Benchmarking list operations will upload --objects objects of size --obj.size with --concurrent prefixes.
The list operations are done per prefix.
If versioned listing should be tested, it is possible by setting --versions=N (default 1),
which will add multiple versions of each object and use ListObjectVersions for listing.
The analysis will include the upload stats as PUT operations and the LIST operations separately.
The time from request start to first object is recorded as well and can be accessed using the --analyze.v parameter.
Operation: LIST
* Average: 10.06 MiB/s, 1030.01 obj/s

Throughput, split into 59 x 1s:
 * Fastest: 11.3MiB/s, 1159.69 obj/s
 * 50% Median: 10.3MiB/s, 1059.06 obj/s
 * Slowest: 6.7MiB/s, 685.26 obj/s
Benchmarking stat object operations
will upload --objects objects of size --obj.size with --concurrent prefixes.
If versioned listing should be tested, it is possible by setting --versions=n (default 1),
which will add multiple versions of each object and request information for individual versions.
The main benchmark will do individual requests to get object information for the uploaded objects.
Since the object size is of little importance, only objects per second is reported.
Example:
$ warp stat --autoterm
[...]
-------------------
Operation: STAT
* Average: 10.06 MiB/s, 1030.01 obj/s

Throughput, split into 59 x 1s:
 * Fastest: 11.3MiB/s, 1159.69 obj/s
 * 50% Median: 10.3MiB/s, 1059.06 obj/s
 * Slowest: 6.7MiB/s, 685.26 obj/s
Benchmarking PutObjectRetention operations
will upload --objects objects of size --obj.size with --concurrent prefixes and --versions versions on each object.
Example:
λ warp retention --objects=2500 --duration=1m
[...]
----------------------------------------
Operation: RETENTION
* Average: 169.50 obj/s

Throughput by host:
 * http://192.168.1.78:9001: Avg: 85.01 obj/s
 * http://192.168.1.78:9002: Avg: 84.56 obj/s

Throughput, split into 59 x 1s:
 * Fastest: 203.45 obj/s
 * 50% Median: 169.45 obj/s
 * Slowest: 161.73 obj/s
Note that since object locking can only be specified when creating a bucket, it may be needed to recreate the bucket. Warp will attempt to do that automatically.
Multipart benchmark will upload parts to a single object, and afterwards test download speed of parts.
When running in distributed mode each client will upload the number of parts specified.
Only --concurrent uploads will be started by each client,
so having --parts be a multiple of --concurrent is recommended, but not required.
λ warp multipart --parts=500 --part.size=10MiB
warp: Benchmark data written to "warp-remote-2022-07-15[190649]-bRtD.csv.zst"

----------------------------------------
Operation: PUT
* Average: 470.88 MiB/s, 47.09 obj/s

Throughput, split into 15 x 1s:
 * Fastest: 856.9MiB/s, 85.69 obj/s
 * 50% Median: 446.7MiB/s, 44.67 obj/s
 * Slowest: 114.1MiB/s, 11.41 obj/s

----------------------------------------
Operation: GET
* Average: 1532.79 MiB/s, 153.28 obj/s

Throughput, split into 9 x 1s:
 * Fastest: 1573.7MiB/s, 157.37 obj/s
 * 50% Median: 1534.1MiB/s, 153.41 obj/s
 * Slowest: 1489.5MiB/s, 148.95 obj/s
warp: Cleanup done.
The zip command benchmarks the MinIO s3zip extension
that allows
This will upload a single zip file with 10000 individual files (change with --files) of 10KiB each (changed with --obj.size).
The benchmark will then download individual files concurrently and present the result as a GET benchmark.
Example:
λ warp zip --obj.size=1MiB -duration=1m
warp: Benchmark data written to "warp-zip-2022-12-02[150109]-xmXj.csv.zst"

----------------------------------------
Operation: GET
* Average: 728.78 MiB/s, 728.78 obj/s

Throughput, split into 59 x 1s:
 * Fastest: 757.0MiB/s, 756.96 obj/s
 * 50% Median: 732.7MiB/s, 732.67 obj/s
 * Slowest: 662.7MiB/s, 662.65 obj/s
This will only work on recent MinIO versions, from 2022 and going forward.
The Snowball benchmark will test uploading a "snowball" TAR file with multiple files inside that are extracted as individual objects.
Parameters:
--obj.size=Ncontrols the size of each object inside the TAR file that is uploaded. Default is 512KiB.--objs.per=Ncontrols the number of objects per TAR file. Default is 50.--compresswill compress the TAR file before upload. Object data will be duplicated inside each TAR. This limits--obj.sizeto 10MiB.
Since TAR operations are done in-memory the total size is limited to 1GiB.
This is calculated as --obj.size * --concurrent.
If --compress is NOT specified this is also multiplied by --objs.per.
Examples:
Benchmark using default parameters. 50 x 512KiB duplicated objects inside each TAR file. Compressed.
λ warp snowball --duration=30s --compress
warp: Benchmark data written to "warp-snowball-2023-04-06[115116]-9S9Z.csv.zst"

----------------------------------------
Operation: PUT
* Average: 223.90 MiB/s, 447.80 obj/s

Throughput, split into 26 x 1s:
 * Fastest: 261.0MiB/s, 522.08 obj/s
 * 50% Median: 237.7MiB/s, 475.32 obj/s
 * Slowest: 151.6MiB/s, 303.27 obj/s
warp: Cleanup Done.
Test 1000 unique 1KB objects inside each snowball, with 2 concurrent uploads running:
λ warp snowball --duration=60s --obj.size=1K --objs.per=1000 --concurrent=2
warp: Benchmark data written to "warp-snowball-2023-04-06[114915]-W3zw.csv.zst"

----------------------------------------
Operation: PUT
* Average: 0.93 MiB/s, 975.72 obj/s

Throughput, split into 56 x 1s:
 * Fastest: 1051.9KiB/s, 1077.12 obj/s
 * 50% Median: 1010.0KiB/s, 1034.26 obj/s
 * Slowest: 568.2KiB/s, 581.84 obj/s
warp: Cleanup Done.
The analysis throughput represents the object count and sizes as they are written when extracted.
Request times shown with --analyze.v represents request time for each snowball.
The Fanout benchmark will test uploading a single object that is copied to multiple individual objects. This feature is only available on a recent MinIO server.
Parameters:
--obj.size=Ncontrols the size of each object that is uploaded. Default is 1MiB.--copies=Ncontrols the number of object copies per request. Default is 100.
Size is calculated as --obj.size * --copies.
Example: Use 8 concurrent uploads to copy a 512KB objects to 50 locations.
λ warp fanout --copies=50 --obj.size=512KiB --concurrent=8
warp: Benchmark data written to "warp-fanout-2023-06-15[105151]-j3qb.csv.zst"

----------------------------------------
Operation: POST
* Average: 113.06 MiB/s, 226.12 obj/s

Throughput, split into 57 x 1s:
 * Fastest: 178.4MiB/s, 356.74 obj/s
 * 50% Median: 113.9MiB/s, 227.76 obj/s
 * Slowest: 56.3MiB/s, 112.53 obj/s
warp: Cleanup Done.
The analysis throughput represents the object count and sizes as they are written when extracted.
Request times shown with --analyze.v represents request time for each fan-out call.
When benchmarks have finished all request data will be saved to a file and an analysis will be shown.
The saved data can be re-evaluated by running warp analyze (filename).
All analysis will be done on a reduced part of the full data. The data aggregation will start when all threads have completed one request and the time segment will stop when the last request of a thread is initiated.
This is to exclude variations due to warm-up and threads finishing at different times. Therefore the analysis time will typically be slightly below the selected benchmark duration.
Example:
Operation: GET
* Average: 92.05 MiB/s, 9652.01 obj/s
The benchmark run is then divided into fixed duration segments specified by -analyze.dur.
For each segment the throughput is calculated across all threads.
The analysis output will display the fastest, slowest and 50% median segment.
Throughput, split into 59 x 1s:
 * Fastest: 97.9MiB/s, 10269.68 obj/s
 * 50% Median: 95.1MiB/s, 9969.63 obj/s
 * Slowest: 66.3MiB/s, 6955.70 obj/s
Beside the important --analyze.dur which specifies the time segment size for
aggregated data there are some additional parameters that can be used.
Specifying --analyze.v will output time aggregated data per host instead of just averages.
For instance:
Throughput by host:
 * http://127.0.0.1:9001: Avg: 81.48 MiB/s, 81.48 obj/s (4m59.976s)
        - Fastest: 86.46 MiB/s, 86.46 obj/s (1s)
        - 50% Median: 82.23 MiB/s, 82.23 obj/s (1s)
        - Slowest: 68.14 MiB/s, 68.14 obj/s (1s)
 * http://127.0.0.1:9002: Avg: 81.48 MiB/s, 81.48 obj/s (4m59.968s)
        - Fastest: 87.36 MiB/s, 87.36 obj/s (1s)
        - 50% Median: 82.28 MiB/s, 82.28 obj/s (1s)
        - Slowest: 68.40 MiB/s, 68.40 obj/s (1s)
--analyze.op=GET will only analyze GET operations.
Specifying --analyze.host=http://127.0.0.1:9001 will only consider data from this specific host.
Warp will automatically discard the time taking the first and last request of all threads to finish.
However, if you would like to discard additional time from the aggregated data,
this is possible. For instance analyze.skip=10s will skip the first 10 seconds of data for each operation type.
Note that skipping data will not always result in the exact reduction in time for the aggregated data since the start time will still be aligned with requests starting.
By adding the --analyze.v parameter it is possible to display per request statistics.
This is not enabled by default, since it is assumed the benchmarks are throughput limited, but in certain scenarios it can be useful to determine problems with individual hosts for instance.
Example:
Operation: GET (386413). Ran 1m0s. Concurrency: 20. Hosts: 2.

Requests considered: 386334:
 * Avg: 3ms, 50%: 3ms, 90%: 4ms, 99%: 8ms, Fastest: 1ms, Slowest: 504ms
 * TTFB: Avg: 3ms, Best: 1ms, 25th: 3ms, Median: 3ms, 75th: 3ms, 90th: 4ms, 99th: 8ms, Worst: 504ms
 * First Access: Avg: 3ms, 50%: 3ms, 90%: 4ms, 99%: 10ms, Fastest: 1ms, Slowest: 18ms
 * First Access TTFB: Avg: 3ms, Best: 1ms, 25th: 3ms, Median: 3ms, 75th: 3ms, 90th: 4ms, 99th: 10ms, Worst: 18ms
 * Last Access: Avg: 3ms, 50%: 3ms, 90%: 4ms, 99%: 7ms, Fastest: 2ms, Slowest: 10ms
 * Last Access TTFB: Avg: 3ms, Best: 1ms, 25th: 3ms, Median: 3ms, 75th: 3ms, 90th: 4ms, 99th: 7ms, Worst: 10ms

Requests by host:
 * http://127.0.0.1:9001 - 193103 requests:
        - Avg: 3ms Fastest: 1ms Slowest: 504ms 50%: 3ms 90%: 4ms
        - First Byte: Avg: 3ms, Best: 1ms, 25th: 3ms, Median: 3ms, 75th: 3ms, 90th: 4ms, 99th: 8ms, Worst: 504ms
 * http://127.0.0.1:9002 - 193310 requests:
        - Avg: 3ms Fastest: 1ms Slowest: 88ms 50%: 3ms 90%: 4ms
        - First Byte: Avg: 3ms, Best: 1ms, 25th: 3ms, Median: 3ms, 75th: 3ms, 90th: 4ms, 99th: 8ms, Worst: 88ms

Throughput:
* Average: 1.57 MiB/s, 6440.36 obj/s

Throughput by host:
 * http://127.0.0.1:9001:
        - Average:  0.79 MiB/s, 3218.47 obj/s
        - Fastest: 844.5KiB/s
        - 50% Median: 807.9KiB/s
        - Slowest: 718.9KiB/s
 * http://127.0.0.1:9002:
        - Average:  0.79 MiB/s, 3221.85 obj/s
        - Fastest: 846.8KiB/s
        - 50% Median: 811.0KiB/s
        - Slowest: 711.1KiB/s

Throughput, split into 59 x 1s:
 * Fastest: 1688.0KiB/s, 6752.22 obj/s (1s, starting 12:31:40 CET)
 * 50% Median: 1621.9KiB/s, 6487.60 obj/s (1s, starting 12:31:17 CET)
 * Slowest: 1430.5KiB/s, 5721.95 obj/s (1s, starting 12:31:59 CET)
TTFBis the time from request was sent to the first byte was received.First Accessis the first access per object.Last Accessis the last access per object.
The fastest and slowest request times are shown, as well as selected percentiles and the total amount is requests considered.
Note that different metrics are used to select the number of requests per host and for the combined, so there will likely be differences.
It is possible to output the CSV data of analysis using --analyze.out=filename.csv
which will write the CSV data to the specified file.
These are the data fields exported:
| Header | Description |
|---|---|
index |
Index of the segment |
op |
Operation executed |
host |
If only one host, host name, otherwise empty |
duration_s |
Duration of the segment in seconds |
objects_per_op |
Objects per operation |
bytes |
Total bytes of operations (distributed) |
full_ops |
Operations completely contained within segment |
partial_ops |
Operations that either started or ended outside the segment, but was also executed during segment |
ops_started |
Operations started within segment |
ops_ended |
Operations ended within the segment |
errors |
Errors logged on operations ending within the segment |
mb_per_sec |
MiB/s of operations within the segment (distributed) |
ops_ended_per_sec |
Operations that ended within the segment per second |
objs_per_sec |
Objects per second processed in the segment (distributed) |
start_time |
Absolute start time of the segment |
end_time |
Absolute end time of the segment |
Some of these fields are distributed. This means that the data of partial operations have been distributed across the segments they occur in. The bigger a percentage of the operation is within a segment the larger part of it has been attributed there.
This is why there can be a partial object attributed to a segment, because only a part of the operation took place in the segment.
It is possible to compare two recorded runs using the warp cmp (file-before) (file-after) to
see the differences between before and after.
There is no need for 'before' to be chronologically before 'after', but the differences will be shown
as change from 'before' to 'after'.
An example:
λ warp cmp warp-get-2019-11-29[125341]-7ylR.csv.zst warp-get-2019-202011-29[124533]-HOhm.csv.zst
-------------------
Operation: PUT
Duration: 1m4s -> 1m2s
* Average: +2.63% (+1.0 MiB/s) throughput, +2.63% (+1.0) obj/s
* Fastest: -4.51% (-4.1) obj/s
* 50% Median: +3.11% (+1.1 MiB/s) throughput, +3.11% (+1.1) obj/s
* Slowest: +1.66% (+0.4 MiB/s) throughput, +1.66% (+0.4) obj/s
-------------------
Operation: GET
Operations: 16768 -> 171105
Duration: 30s -> 5m0s
* Average: +2.10% (+11.7 MiB/s) throughput, +2.10% (+11.7) obj/s
* First Byte: Average: -405.876µs (-2%), Median: -2.1µs (-0%), Best: -998.1µs (-50%), Worst: +41.0014ms (+65%)
* Fastest: +2.35% (+14.0 MiB/s) throughput, +2.35% (+14.0) obj/s
* 50% Median: +2.81% (+15.8 MiB/s) throughput, +2.81% (+15.8) obj/s
* Slowest: -10.02% (-52.0) obj/s
All relevant differences are listed. This is two warp get runs.
Differences in parameters will be shown.
The usual analysis parameters can be applied to define segment lengths.
It is possible to merge runs from several clients using the warp merge (file1) (file2) [additional files...] command.
The command will output a combined data file with all data that overlap in time.
The combined output will effectively be the same as having run a single benchmark with a higher concurrency setting. The main reason for running the benchmark on several clients would be to help eliminate client bottlenecks.
It is important to note that only data that strictly overlaps in absolute time will be considered for analysis.
Warp allows realtime statistics to be pushed to InfluxDB v2 or later.
This can be combined with the --stress parameter, which will allow to have long-running tests without consuming memory and still get access to performance numbers.
Warp does not provide any analysis on the data sent to InfluxDB.
InfluxDB is enabled via a the --influxdb parameter. Alternatively the parameter can be set in the WARP_INFLUXDB_CONNECT environment variable.
The value must be formatted like a URL: <schema>://<token>@<hostname>:<port>/<bucket>/<org>?<tag=value>
| Part | |
|---|---|
<schema> |
Connection type. Replace with http or https |
<token> |
Replace with the token needed to access the server |
<hostname> |
Replace with the host name or IP address of your server |
<port> |
Replace with the port of your server |
<bucket> |
Replace with the bucket in which to place the data |
<org> |
Replace with the organization to which the data should be associated (if any) |
<tag=value> |
One or more tags to add to each data point |
Each parameter can be URL encoded.
Example:
--influxdb "http://shmRUvVjk0Ig2J9qU0_g349PF6l-GB1dmwXUXDh5qd19n1Nda_K7yvSIi9tGpax9jyOsmP2dUd-md8yPOoDNHg==@127.0.0.1:8086/mybucket/myorg?mytag=myvalue"
This will connect to port 8086 on 127.0.0.1 using the provided token shmRU....
Data will be placed in mybucket and associated with myorg. An additional tag mytag will be set to myvalue on all data points.
For distributed benchmarking all clients will be sending data, so hosts like localhost and 127.0.0.1 should not be used.
All in-run measurements are of type warp.
| Tag | Value |
|---|---|
warp_id |
Contains a random string value, unique per client. This can be used to identify individual runs or single warp clients when using distributed benchmarks. |
op |
Contains the operation type, for example GET, PUT, DELETE, etc. |
endpoint |
Endpoint is the endpoint to which the operation was sent. Measurements without this value is total for the warp client. |
Fields are sent as accumulated totals per run per operation type.
New metrics are sent as each operation (request) completes. There is no inter-operation progress logged. This means that bigger objects (meaning less requests) will create bigger fluctuations. That is important to note when analyzing.
| Field | Value |
|---|---|
requests |
Total number of requests performed |
objects |
Total number of objects affected |
bytes_total |
Total number of bytes affected |
errors |
Total errors encountered |
request_total_secs |
Total request time in seconds |
request_ttfb_total_secs |
Total time to first byte in seconds for relevant operations |
The statistics provided means that to get "rates over time" the numbers must be calculated as differences (increase/positive derivatives).
When a run has finished a summary will be sent. This will be a warp_run_summary measurement type.
In addition to the fields above it will contain:
| Field | Value |
|---|---|
request_avg_secs |
Average Request Time |
request_max_secs |
Longest Request Time |
request_min_secs |
Shortest Request Time |
request_ttfb_avg_secs |
Average Time To First Byte (TTFB) |
request_ttfb_max_secs |
Longest TTFB |
request_ttfb_min_secs |
Shortest TTFB |
All times are in float point seconds.
The summary will be sent for each host and operation type.
When running against a MinIO server it is possible to enable profiling while the benchmark is running.
This is done by adding --serverprof=type parameter with the type of profile you would like.
This requires that the credentials allows admin access for the first host.
| Type | Description |
|---|---|
cpu |
CPU profile determines where a program spends its time while actively consuming CPU cycles (as opposed while sleeping or waiting for I/O). |
mem |
Heap profile reports the currently live allocations; used to monitor current memory usage or check for memory leaks. |
block |
Block profile show where goroutines block waiting on synchronization primitives (including timer channels). |
mutex |
Mutex profile reports the lock contentions. When you think your CPU is not fully utilized due to a mutex contention, use this profile. |
trace |
A detailed trace of execution of the current program. This will include information about goroutine scheduling and garbage collection. |
Profiles for all cluster members will be downloaded as a zip file.
Analyzing the profiles requires the Go tools to be installed. See Profiling Go Programs for basic usage of the profile tools and an introduction to the Go execution tracer for more information.