A two day class for introducing concepts and modern tools of geospatial data visualization to data scientists.
These workshops are designed to be very hands-on, with many examples that can be extended as exercises. However, we know it would be impossible to go in-depth with everything that we could find interesting in web mapping! So our goal is to give you a good understanding of the mapping landscape, with some concrete experience with some key mapping tools. The hope is that after going through these examples in class and on your own you will feel empowered to swap in your own data and leverage hundreds of examples in your own data visualization projects!
DO THIS FIRST:
- Sign up for a free account on CARTO.com
- Sign up for a free account on github.com (if you don't already have one)
Covers the basics of web mapping, commonly used geospatial data structures for the web, and a range of options for how to create interactive spatial data Visualizations. Day one will leave you in good shape for diving deeper into interactively visualizing spatial data on the web.
Introduction to tiled maps and web friendly geospatial data structures.
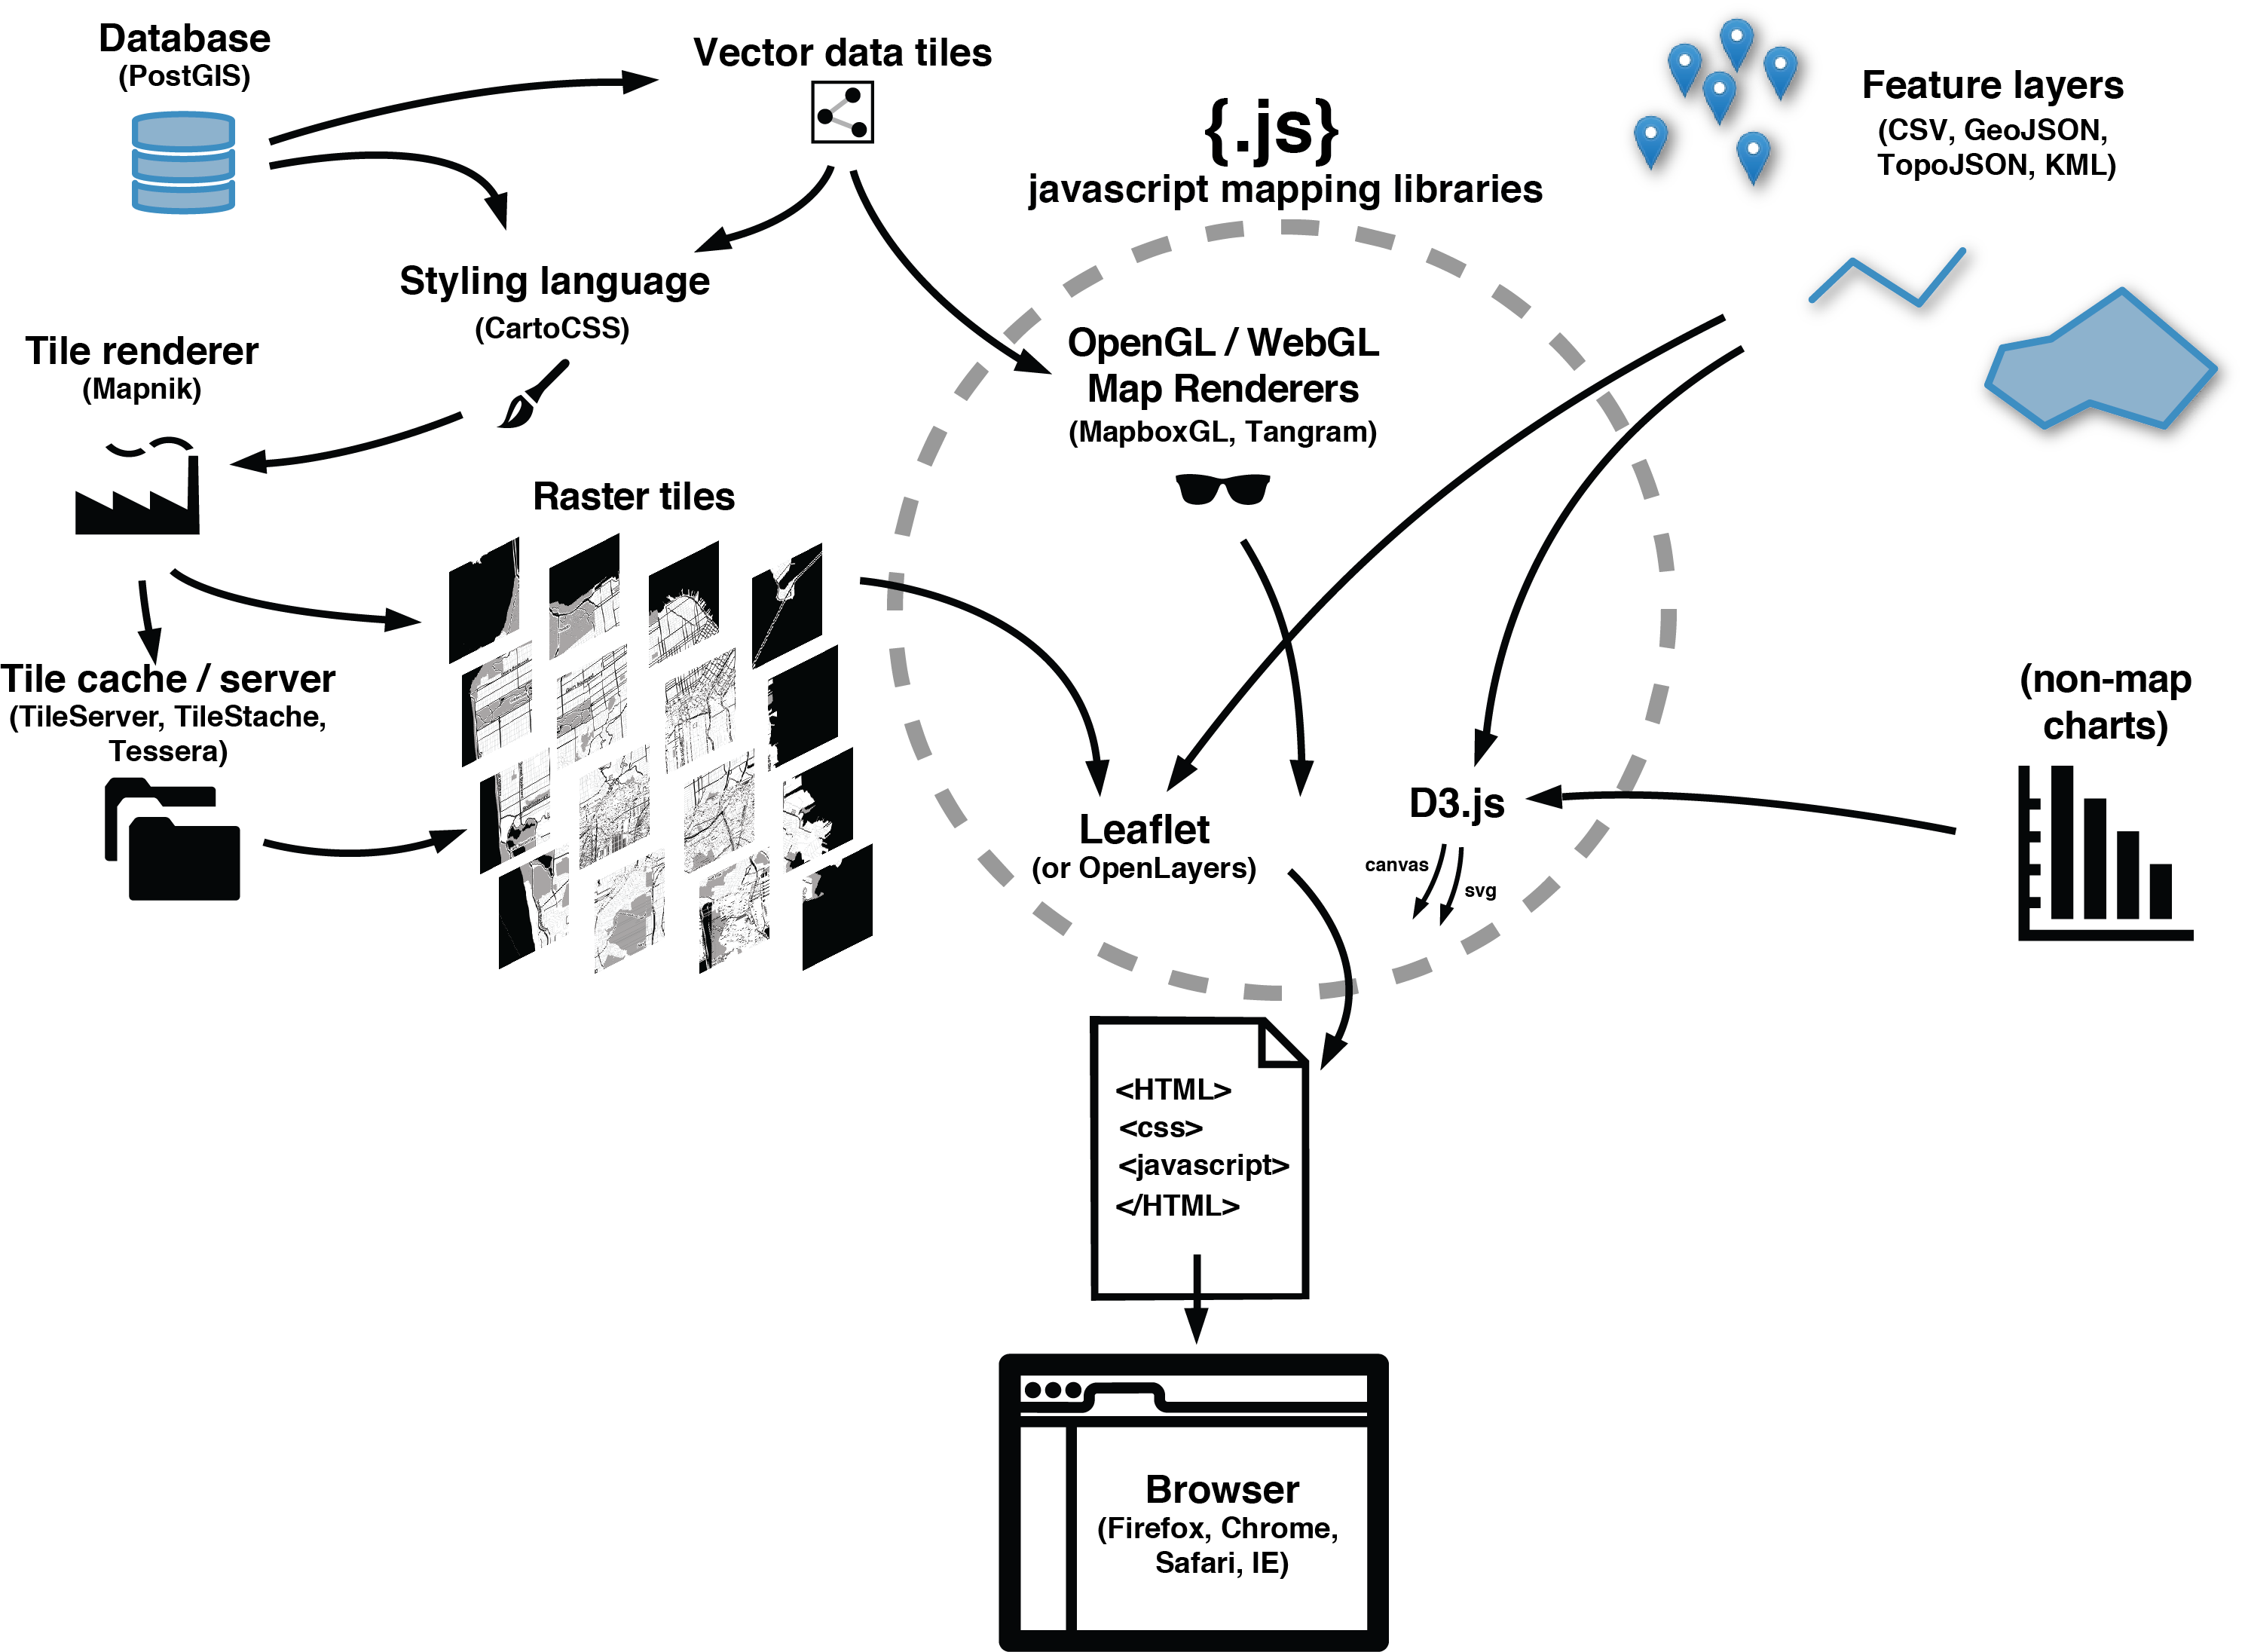
Leaflet.JS is a well known javascript library that allows for creating highly customized interactive web maps. We will demonstrate how get up and running with Leaflet by adding a Tile Layer and GeoJSON Layer. We will also take a quick look at MapboxGL and Mapzen's Tangram, tools that allow for utilizing the CPU graphics card to improve performance and expand what's capable with web mapping.
Getting your first Leaflet map working with Blockbuilder.org
-
Example 1: Create a bl.ock, load Leaflet starter
-
Example 2: Change tile provider. Leaflet starter (Toner basemap)
-
Example 3: Leaflet with scale bar and URL hash using plugins.
-
Example 4: Leaflet starter with GeoJSON overlay (tip: use GeoJSON.io to inspect or create GeoJSON)
-
Example 5: Leaflet with GeoJSON styling and interaction
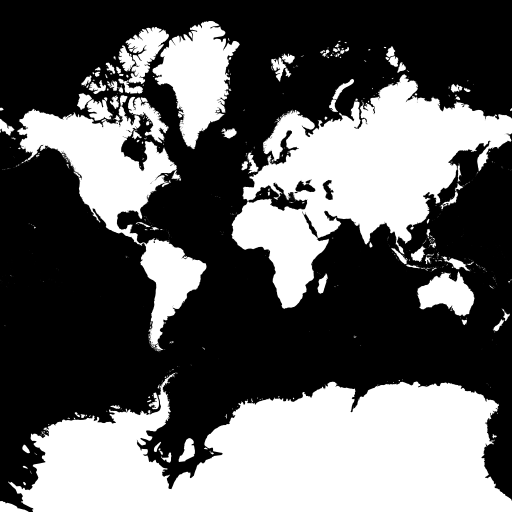
Observe the stark difference between the raster basemap and the vector data overlay. These two parts of the map are created differently, they behave differently, and the even look different! For a long time this is what all web maps were like. But from here on out we'll see how the boundaries between basemap and overlay are starting to blur:
-
Quick demo of MapboxGL (compare to leaflet w/ same data): Example 6: MapboxGL vs Leaflet
-
Tangram is another GL-based renderer. Example 7: Tangram simple demo
CARTO is a web based platform for analyzing and visualizing spatial data. The new CARTO Builder platform (being rolled out this month!) is a revamp of their previous Editor and allows users to perform complex spatial analysis, create widgets, and share maps without having to write a line of code. CARTO has a suite of API's which makes it a great "backend" for data visualizations on the web, allowing developers to leverage SQL, PostGIS, and CartoCSS in their web applications. We will give a brief tour of the platform and demonstrate how to incorporate data ("tables") from CARTO into Leaflet.
- Dashboard overview
- Data vs. Maps views
- Data Library
- Data Observatory
- Widgets & Analysis
- Exporting Data
- Integrating the CARTO SQL API with Leaflet
- Creating a Leaflet
tileLayerfrom a CARTO table - Resources for learning more
Using Carto.JS and the Carto SQL API we can load data from a table located in CARTO into a Leaflet map.
-
Example 1: Loading GeoJSON from a Carto Table
-
Example 2: Loading a Carto Table as a TileLayer
-
Example 1 extended: Advanced GeoJSON usage
-
Example 2 extended: Advanced Carto TileLayer usage
D3.js is a client-side javascript visualization and mapping library that differs from Leaflet and CARTO in many fundamental ways. Rather than relying on raster map tiles rendered on a server, D3 draws geometries in the browser using SVG or canvas. In the final section of today's workshop, we'll explore some of the possibilities that D3 opens up.
- Example 1: D3 map demo
- Example 1a: D3 map demo using D3.v4
Before we get too far into D3 mapping we need to talk about TopoJSON, which is an extension of GeoJSON that encodes topology. One of the biggest benefits of this is that file sizes can be significantly smaller.
A couple tools that can be used to orient yourself with TopoJSON files:
-
Example 2: D3 with TopoJSON
You can create TopoJSON using the command line tools, or using a tool like MapShaper, which also gives you the ability to generalize your shapes. Generalizing reduces the level of detail in your data, which makes for smaller file sizes, and is often desirable for more elegant and visually pleasing maps.
- Example 3: Generalizing in MapShaper
Map projections are an important concept, and we need at least a basic grasp of how they work to make the kinds of custom maps that showcase the power of D3.
One point we need to emphasize is that projections introduce distortion, to get a sense for how different projections distort the geometry of the earth play with this example:
Modify our Example 1 to use one of D3's many other projections.
- Example 4: D3 map using Winkel Tripel projection
Unless you are using a tiled basemap, you should choose an appropriate projection based on the needs of your visualization:
- If you're making a choropleth (we'll talk about these later), use an equal area projection.
- Map of the US, use Albers USA which has built-in sub-projections for Alaska and Hawaii!
- Say, California, use EPSG:3310 California Albers
- Map of the world, consider a Winkel Tripel (although it's not an equal area projection)
- For a city, maybe it doesn't matter if you use Mercator.
Now that we've seen a variety of projections, why do tiled web maps use Mercator? For one thing the whole world fits (almost) perfectly in the square zoom 0 tile. All other tiles are subdivisions of this one.
Note: D3 is convenient and it gives all these projections names, but if you're using anything other than D3, you might need to know your projection's EPSG code.
A few you might memorize after a while:
- EPSG:4326 "unprojected" latitude / longitude (a "geographic" projection)
- EPSG:3857 Web ("Google") Mercator (old docs will use EPSG:900913)
- EPSG:2163 US National Atlas Azimuthal Equal Area
- EPSG:3310 California Albers
Finally, we can switch back to CARTO and put these projection codes to work: With the right PostGIS query we are able to use raster tiles in non-Mercator projections! Just don't try to overlay them with any other raster maps!
SELECT ST_Transform(the_geom, 2163) AS the_geom_webmercator FROM tablename
For more information about projections in CARTO, see Free Your Maps From Web Mercator
Example: D3 choropleth
Example: value-by-alpha choropleth. See also American Panorama foreign born map
Example: Diverging color schemes
Example: Trivariate choropleth
See also: blending CMYK colors: Trees, Cabs, Crime, our climate change maps for the Audubon Society.
See D3 choropleth above, but try using other options instead of d3.scaleLinear
Example: Pop vs soda hexbins in CARTO
Example: geocoded social media hexbins in CARTO
Example: American Panorama hexbins
Example: resizing hexbins on the fly in D3
Example: dynamic hexbins in D3
How do we view the results of our queries?
- CARTO is the most fool-proof and interactive method
- postgis-preview is a simple offline viewer with interactive queries, but requires your data to be in WGS84 (lat/lon, EPSG:4326).
- QGIS can connect to PostGIS, but you have to save your query results to a new table to view them.
- TileMill still works, but you have to install it from source.
Some useful PostGIS functions, and real-world examples from Stamen projects:
ST_Distance: (used in the background for the Blue Greenway map)
SELECT a.cartodb_id, a.the_geom_webmercator, ST_Distance(a.the_geom_webmercator, b.the_geom_webmercator) as dist FROM sf_parcels_clipped a, bluegreenway_line_snapped b
ST_Intersection, ST_Intersects: (see also ST_Contains)
Find all the buildings in the forest (example using an osm2pgsql OSM database, and transformed for display using postgis-preview):
SELECT ST_Transform(a.way,4326) AS geom FROM planet_osm_polygon a, planet_osm_polygon b WHERE a.building='yes' AND b.landuse='forest' AND ST_Intersects(a.way,b.way)
Find all the road segemnts that pass through the forest:
SELECT ST_Transform(a.way,4326) AS geom FROM planet_osm_roads a, planet_osm_polygon b WHERE a.highway IS NOT NULL AND b.landuse='forest' AND ST_Intersects(a.way,b.way)
Find only the parts of those road segments that are in the forest:
SELECT ST_Transform(ST_Intersection(a.way,b.way),4326) AS geom FROM planet_osm_roads a, planet_osm_polygon b WHERE a.highway IS NOT NULL AND b.landuse='forest' AND ST_Intersects(a.way,b.way)
ST_MakeValid:
SELECT cartodb_id, ST_MakeValid(the_geom), bgw_id, name FROM bgw_projects
ST_Union:
SELECT ST_Union(the_geom_webmercator) as the_geom_webmercator, 'p70' as bgw_zone, 6383 as bgw_id, 'Pier 70' as name, null as pdf_id, 'open space' as category, 1000 as cartodb_id, false as id_is_fake FROM bgw_projects WHERE name IN ('Pier 70 Upland Open Spaces', 'Pier 70 Slipways Park', 'Pier 70 Crane Cove Park')
ST_Centroid:
SELECT a.cartodb_id, a.users_shared, a.senate_24_superunit_id, a.senate24total, a.coastal_superunit_id, a.coastaltotal, b.unit_name AS senate_24_superunit_name, c.unit_name AS coastal_superunit_name, ST_MakeLine(ST_Centroid(b.the_geom_webmercator),ST_Centroid(c.the_geom_webmercator)) as the_geom_webmercator FROM "stamen-org".coastal_connections_senate_24 a, harvester_cpad_2015a_superunits b, harvester_cpad_2015a_superunits c WHERE a.senate_24_superunit_id = b.superunit_id AND a.coastal_superunit_id = c.superunit_id
ST_MakeLine:
UPDATE grants_from_to SET the_geom = ST_SetSRID(ST_MakeLine(ST_MakePoint(fromlng,fromlat),ST_MakePoint(tolng,tolat)), 4326);
ST_GeometryFromText, if you want to create simply geometries using Well-Known Text (WKT) format:
create table sf_parks as select * from cpad_units where ST_Intersects(ST_Transform(geom, 4326), ST_GeometryFromText('POLYGON((-123.2 36.7, -123.2 38.7, -121.6 38.7, -121.6 36.7, -123.2 36.7))',4326));
ST_SnapToGrid:
SELECT ST_Union(ST_SnapToGrid(the_geom,0.0001)) as the_geom, region
ST_Difference:
SELECT 2 as cartodb_id, ST_Difference(a.the_geom_webmercator, b.the_geom_webmercator) as the_geom_webmercator, 'Tanzania' as name, 0 as dn FROM tza_adm0_simplified a, sagcot b
ST_CollectionsExtract, ST_Collect: because sometimes you need to split apart geometries to operate on their individual pieces:
insert into regular_delaunay (select 25000 as spacing, ST_CollectionExtract(ST_DelaunayTriangles(ST_Collect(centroid)), 3) geom from hexagons where spacing::text = '25000');
CDB_HexagonGrid: (a CartoDB built-in function for making a hexagonal grid). Used for American Panorama
create table hexbin_test as select CDB_HexagonGrid(ST_Collect(ST_transform(the_geom, 2163)), 50000, ST_SetSRID(ST_MakePoint(0,0),2163)) as the_geom_webmercator from states
ST_SummaryStats (figure out the count, mean, stddev, etc. for intersecting raster cells):
update regular_delaunay_dump SET aspect = (SELECT (ST_SummaryStats(ST_Union(ST_Clip(rast, 2, geom_4326, true)))).mean aspect FROM srtm WHERE ST_Intersects(geom_4326, rast)), slope = (SELECT (ST_SummaryStats(ST_Union(ST_Clip(rast, 3, geom_4326, true)))).mean aspect FROM srtm WHERE ST_Intersects(geom_4326, rast)), hillshade = (SELECT (ST_SummaryStats(ST_Union(ST_Clip(rast, 4, geom_4326, true)))).mean aspect FROM srtm WHERE ST_Intersects(geom_4326, rast));
ST_GeoHash: (and why you'd use it)
CREATE MATERIALIZED VIEW places AS SELECT osm_id, tags -> 'place' AS place, tags -> 'name' AS name, tags -> 'population' AS population, the_geom AS the_geom_webmercator FROM planet WHERE tags -> 'place' IN ('city','town','village','hamlet','suburb','neighbourhood') ORDER BY ST_GeoHash(ST_Transform(ST_SetSRID(Box2D(the_geom), 3857), 4326));
Also, some interesting news about Postgres 9.6: Parallel queries in 9.6
Spatial analysis in the browser with turf.js
Example: Using turf.js to measure features
Example: Buffering TopoJSON features using turf.js
Example: Buffering TopoJSON features using turf.js, drawing with canvas
One way to stream CSV data is using PapaParse
Example using a different technique: Streaming Shapefile
Example: World Airports Voronoi
Example: Using Voronoi as UI
Example: Selecting Countries on a Canvas Globe
Example: Canvas Voronoi vs SVG Voronoi
Example using regular react: mapbox-examples master branch
Example using redux: mapbox-examples redux branch
Notice that the repo above uses Mapzen vector tiles in MapboxGL, not Mapbox's tiles.
Example: Using vector tiles in D3