ArchProbe is a profiling tool to demythify and quantify mobile GPU architectures with great details. The mechanism of ArchProbe is introduced in our MobiCom'22 paper "Romou: Rapidly Generate High-Performance Tensor Kernels for Mobile GPUs". We appreciate you cite the paper for using this tool.
@inproceedings{liang2022romou,
  author = {Liang, Rendong and Cao, Ting and Wen, Jicheng and Wang, Manni and Wang, Yang and Zou, Jianhua and Liu, Yunxin},
  title = {Romou: Rapidly Generate High-Performance Tensor Kernels for Mobile GPUs},
  booktitle = {The 28th Annual International Conference On Mobile Computing And Networking (MobiCom 2022)},
  year = {2022},
  month = {February},
  publisher = {ACM},
  doi = {10.1145/3495243.3517020},
}
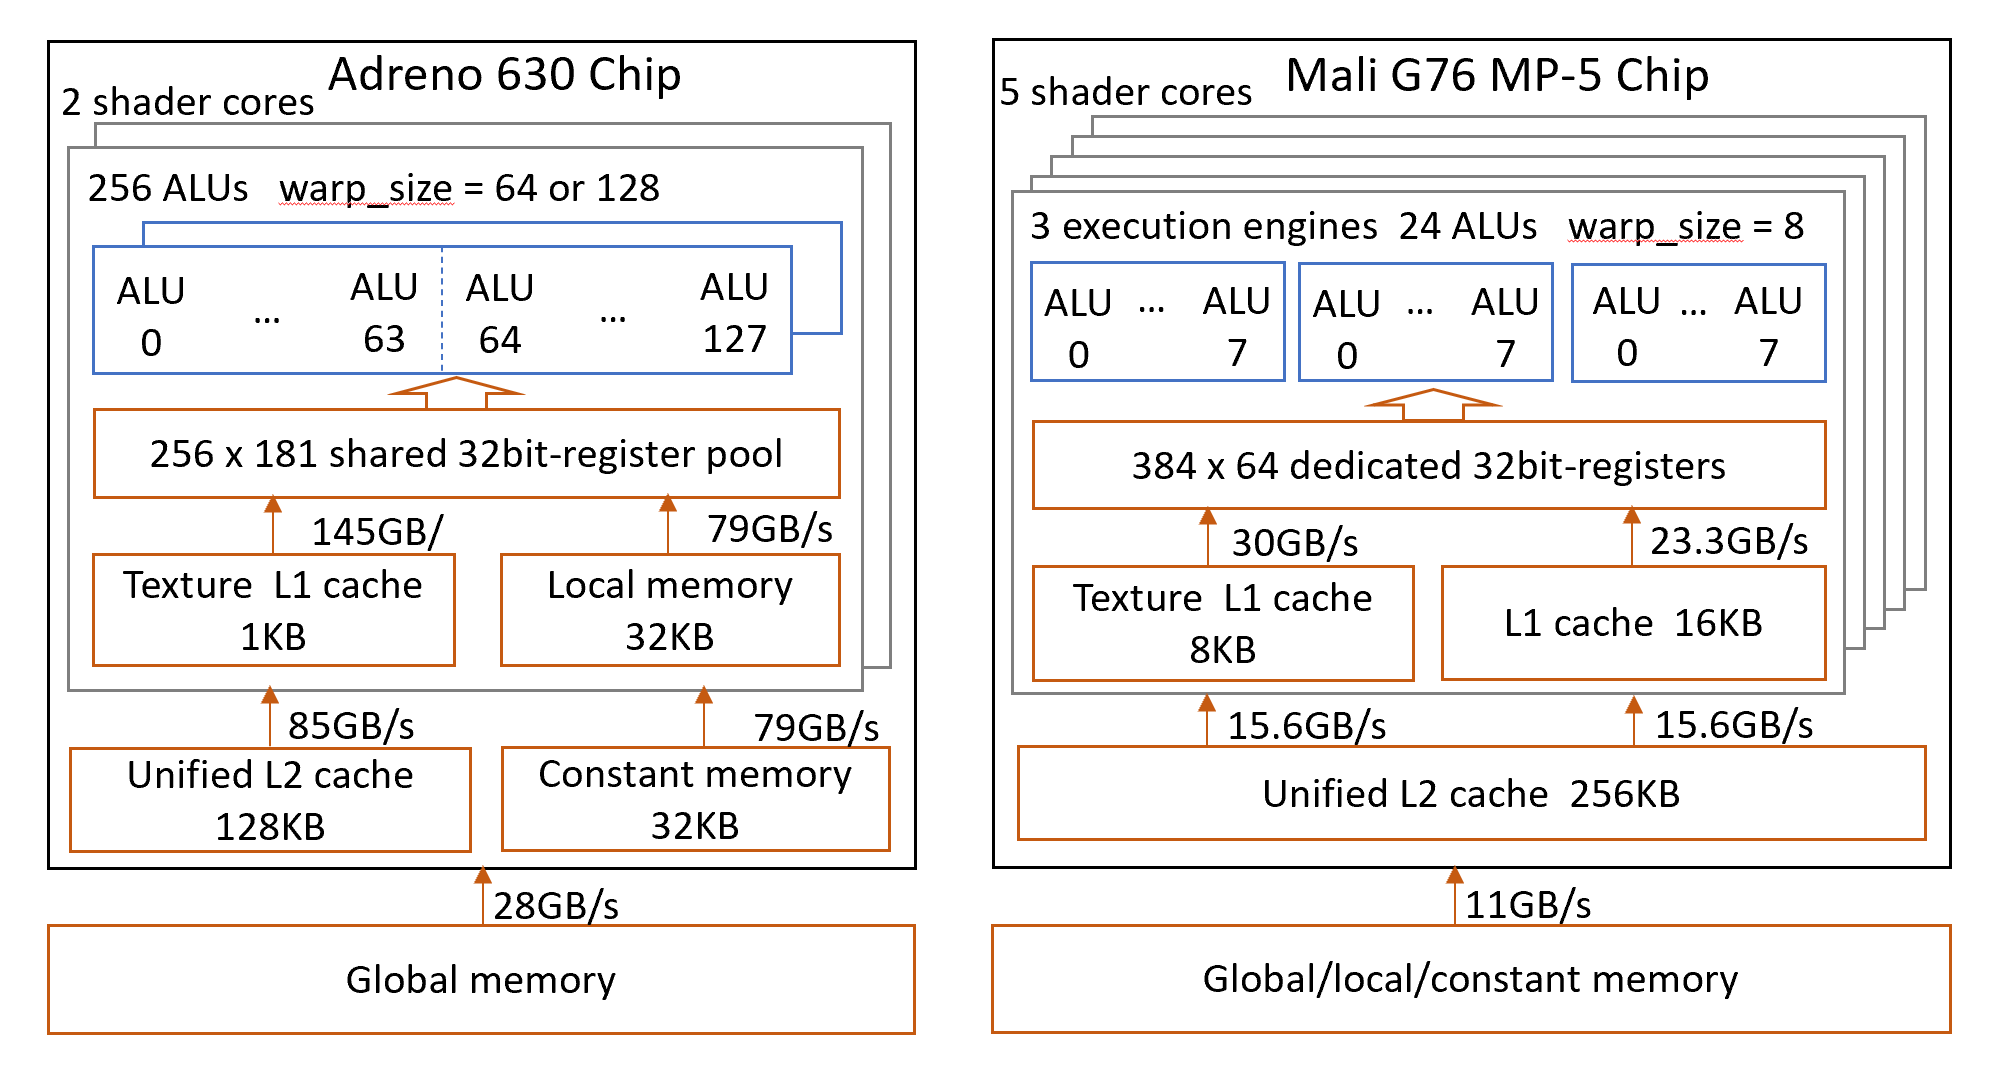
Examples of Architecture Overview prodiled by ArchProbe for Adreno 640 and Mali G76

Architecture details collected with ArchProbe, presented in our technical paper.
In a clone of ArchProbe code repository, the following commands build ArchProbe for most mobile devices with a 64-bit ARMv8 architecture.
git submodule update --init --recursive
mkdir build-android-aarch64 && cd build-android-aarch64
cmake -DCMAKE_TOOLCHAIN_FILE="$ANDROID_NDK/build/cmake/android.toolchain.cmake" -DANDROID_ABI="arm64-v8a" -DANDROID_PLATFORM=android-28 -G "Ninja" ..
cmake --build . -t ArchProbe
To run ArchProbe in command line via adb shell, you need to copy the executables to /data/local/tmp.
If you are using Windows, the PowerShell scripts in scripts can be convenient too:
scripts/Run-Android.ps1 [-Verbose]Prebuilt binaries will be available here.
A GPU hardware has many traits like GFLOPS and cache size. ArchProbe implements a bag of tricks to expose these traits and each implementation is called an aspect. Each aspect has its own configurations in ArchProbe.json, reports in ArchProbeReport.json, and data table of every run of probing kernels in [ASPECT_NAME].csv. Currently ArchProbe implements the following aspects:
WarpSizeMethod{A|B}Two methods to detect the warp size of a GPU core;GFLOPSPeak computational throughput of the device;RegCountNumber of registers available to a thread and whether the register file is shared among warps;BufferVecWidthOptimal vector width to read the most data in a single memory access;{Image|Buffer}CachelineSizeTop level cacheline size of image/buffer;{Image|Buffer|ConstMem|LocalMem}BandwidthPeak read-only bandwidth of image/buffer/constant/local memory;{Image|Buffer}CacheHierarchyPChaseSize of each level of cache of image/buffer by the P-chase method.
If the -v flag is given, ArchProbe prints extra human-readable logs to stdout which is also a good source of information.
Experiment data gathered from Google Pixel 4 can be found here.
ArchProbe allows you to adjsut the sensitivity of the probing algorithms in each aspect. In the config file (by default the generated ArchProbe.json), each aspect has a Threshold for the algorithm to decide whether the difference in timing is significant enough to be identified as a numerical jump; Compensate helps the algorithm to smooth out step-like outputs, for example in cache hierarchy probing.
In some of the aspects (like RegCount) ArchProbe also allows you to choose the parameter space, namely XxxMin, XxxMax and XxxStep. But in most of the cases, you can rely on the default ranges ArchProbe derived from the device.
Although ArchProbe has algorithms to conclude semantical data like bandwidth and computational throughput from execution timing, these algorithms are susceptible to noisy outputs especially under thermal throttling. So it's too recommended to plot the timing data in .csv files to have a better understanding of the architecture.
This project welcomes contributions and suggestions. Most contributions require you to agree to a Contributor License Agreement (CLA) declaring that you have the right to, and actually do, grant us the rights to use your contribution. For details, visit https://cla.opensource.microsoft.com.
When you submit a pull request, a CLA bot will automatically determine whether you need to provide a CLA and decorate the PR appropriately (e.g., status check, comment). Simply follow the instructions provided by the bot. You will only need to do this once across all repos using our CLA.
This project has adopted the Microsoft Open Source Code of Conduct. For more information see the Code of Conduct FAQ or contact opencode@microsoft.com with any additional questions or comments.
This project may contain trademarks or logos for projects, products, or services. Authorized use of Microsoft trademarks or logos is subject to and must follow Microsoft's Trademark & Brand Guidelines. Use of Microsoft trademarks or logos in modified versions of this project must not cause confusion or imply Microsoft sponsorship. Any use of third-party trademarks or logos are subject to those third-party's policies.