STeP is an experimental asychronous data processing pipeline that enables telemetry data to be represented in a generic manner (measurements), and processed via one or more processor nodes in pipelines called node chains.
Processor nodes can be thought of as mini telemetry applications that can be chained together to represent complex data processing workflows.
Processor nodes and node-chains are added to a runtime-updateable node registry. Incoming measurements will be evaluated againt registered and active processor nodes to determine if there is a filter match between the measurement and the first record in the node chain. If a match occurs, the measurement will be processed by the matching node or node chain.
NOTE: STeP is NOT intended to replace Zephyr's sensor API or sensor drivers, but to act as an endpoint for that raw telemetry data!
STeP was presented as a proof of concept at Linaro Connect Fall 2021 in LVC21F-303. This slidedeck provides more detailed information on STeP as of the date that presentation was given.
Click the image below to see a PDF of the slidedeck:

This project is a proof of concept and a work in progress. It is intended to test the concept of a flexible telemetry pipeline that can handle common security requirements such as sanitising, hashing, signing, encrypting and encoding telemetry data, reducing individual operations to reusable building blocks or mini applications.
Eventually, some of these nodes, or the entire system, should be allocated to a trusted execution environment (TF-M, etc.), and linked to an inferrence engine for demonstration purposes. As a first step, however, implementing this as a Zephyr module allows for a flexible CI workflow, easy emulation in QEMU, and rapid development and testing.
The recommended way is to use west to initialize this repository directly and
all its dependencies:
$ west init -m git@github.com:Linaro/step.git
$ west update
Alternatively you can add a local copy of this module by adding the following sections
to zephyr/west.yml:
- In the
manifest/remotessection add:
remotes:
  - name: linaro
    url-base: https://github.com/Linaro
- In the
manifest/projectssection add:
- name: step
  remote: linaro
  path: modules/lib/step
  revision: main
3. Save the file, and run west update from the project root to retrieve the
latest version of the library from Github, or whatever revision was
specified above.
This application can be built and executed on QEMU as follows:
$ west build -p auto -b qemu_cortex_m3 modules/lib/step/samples/shell/ -t runTo build for another board, change qemu_cortex_m3 above to that board's
name, and remove the -t run appendix.
*** Booting Zephyr OS build zephyr-v2.6.0-536-g89212a7fbf5f  ***
Type 'step help' for command options.

1.) Populate the processor registry: step add
2.) Publish measurement(s):          step pub
3.) Check results:                   step stats

uart:~$ step add
[00:01:42.089,072] <dbg> proc_mgr: step_pm_register: Registering node/chain (handle 0, pri 4)
[00:01:42.089,125] <dbg> step_shell: step_shell_cmd_add: Took 53750 ns
uart:~$ step pub
[00:05:38.661,550] <dbg> step_shell: step_shell_cmd_pub: Published 1 measurement
[00:05:38.661,580] <dbg> step_shell: step_shell_cmd_pub: Took 60916 ns, excluding polling thread processing time (run 'step list').
[00:05:38.771,241] <inf> step_shell: [7496940] Received die temp: 32.00 C (handle 0:0)
[00:05:38.771,266] <inf> step_shell: cfg: mult by 10.00 (handle 0:1)
[00:05:38.771,289] <inf> step_shell: [7496940] Received die temp: 320.00 C (handle 0:1)
[00:05:38.771,316] <inf> step_shell: [7496940] Received die temp: 320.00 C (handle 0:2)
uart:~$ step stats
init:     3
evaluate: 0
matched:  1
start:    1
run:      3
stop:     1
error:    0
Exit QEMU by pressing CTRL+A x.
To run the unit tests for this module, you can run twister via:
$ cd $ZEPHYR_BASE
$ twister --inline-logs \
  -p qemu_cortex_m3 \
-T ../modules/lib/step/testsThe Secure Telemetry Pipeline (STeP) aims to implement an extensible workflow to process generic sensor data (measurements) in a content-agnostic manner.
In theory, any type of measurement, using any standard SI unit and scale, and represented in any standard C type should be expressable in a relatively light-weight manner, keeping in mind the memory constraints of small embedded systems.
Processing of measurements happens based on one or more processor nodes, which can be chained together for more complex operations.
Processor nodes have an optional filter mechanism to indicate which types of measurements they process, allowing for processing workflows to be defined on a per-measurement-type basis.
The Secure in STeP comes from the goal to provide basic secure processor nodes out of the box, implementing common operations like: hash, sign, compress, encrypt, etc.
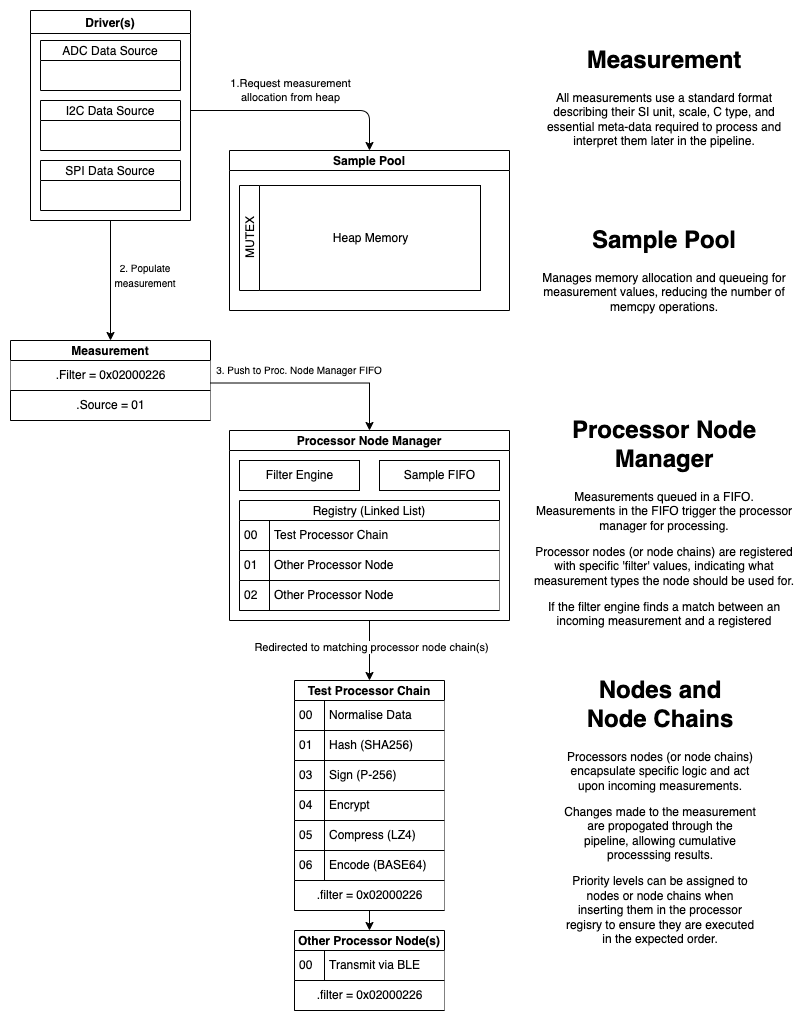
A high-level overview of the system is shown here:
Measurements are the main component in STeP, and traverse the system starting as inputs from a data source, are processed, and output to an appropriate data endpoint.
STeP attempts to compromise between optimising for memory in small embedded systems, and trying to describe exactly what this measurement represents in as expressive a manner as possible. It aims to balance the ability to precisely represent the exact meaning of the measurement, without wasting precious memory on that representation.
Measurements make use of the following header, with a 12-byte overhead:
   3                   2                   1
 1 0 9 8 7 6 5 4 3 2 1 0 9 8 7 6 5 4 3 2 1 0 9 8 7 6 5 4 3 2 1 0
+-+-+-+-+-+-+-+-+-+-+-+-+-+-+-+-+-+-+-+-+-+-+-+-+-+-+-+-+-+-+-+-+
|              Flags            |  Ext. M Type  |  Base M Type  | <- Filter
+-+-+-+-+-+-+-+-+-+-+-+-+-+-+-+-+-+-+-+-+-+-+-+-+-+-+-+-+-+-+-+-+
|     C Type    | Scale Factor  |         SI Unit Type          | <- Unit
+-+-+-+-+-+-+-+-+-+-+-+-+-+-+-+-+-+-+-+-+-+-+-+-+-+-+-+-+-+-+-+-+
|   Source ID   | S Cnt | V | F |        Payload Length         | <- SrcLen
+-+-+-+-+-+-+-+-+-+-+-+-+-+-+-+-+-+-+-+-+-+-+-+-+-+-+-+-+-+-+-+-+
|                      Timestamp (optional)                     |
+-+-+-+-+-+-+-+-+-+-+-+-+-+-+-+-+-+-+-+-+-+-+-+-+-+-+-+-+-+-+-+-+
|                                                               |
|                            Payload                            |
|                                                               |
+-+-+-+-+-+-+-+-+-+-+-+-+-+-+-+-+-+-+-+-+-+-+-+-+-+-+-+-+-+-+-+-+

           1
 5 4 3 2 1 0 9 8 7 6 5 4 3 2 1 0
+-+-+-+-+-+-+-+-+-+-+-+-+-+-+-+-+
| Res | TSt | CMP | Encod |  DF | <- Flags
+-+-+-+-+-+-+-+-+-+-+-+-+-+-+-+-+
    |    |     |      |      |
    |    |     |      |      +-------- Data Format (CBOR, etc.)
    |    |     |      +--------------- Encoding (BASE64, BASE45, etc.)
    |    |     +---------------------- Compression (LZ4, etc.)
    |    +---------------------------- Timestamp
    +--------------------------------- Reserved (version flag?)
For futher technical details, see ìnclude/step/measurement.h, but a
high-level summary of these three key words is shown below:
The Filter word allows processor nodes to determine if this measurement interests them or not.
It consists of an 8-bit Base Measurement Type, and an optional 8-bit Extended Measurement Type, which can be used to specialise the meaning of the base type.
EXAMPLE: STEP_MES_TYPE_LIGHT is a base type, which uses a default
SI unit of STEP_MES_UNIT_SI_LUX. If we wish to represent a different
measurement in the same measurement family (base type), we could indicate
STEP_MES_EXT_TYPE_LIGHT_RADIO_RADIANCE as the extended type, which
represents a radiometric measurement based on W/(sr m^2).
The Flags field indicates other important data about this measurement packet, such as how the data has been formatted, encoded, what compression algorithm has been used (if any), and if a timestamp is present.
The Unit word describes the SI unit and optional scale factor this
measurement uses, as well as how that unit is represented in memory. A 32-bit
floating-point value may use less memory in most cases, but we may require the
additional range and precision a 64-bit float provides. The unit word
allows for a flexible expression of this information on a per-measurement basis,
without an excessive amount of overhead.
Standard SI units, scale factors and C types are all represented via enums in
STeP in the include/step/measurement folder.
The Source/Len word describes the size of the payload, with an option to spread larger payloads over multiple packets.
The vector size field can be set to indicate that individual samples are vectors (versus scalars), consisting of 2, 3 or 4 components. This covers the most common vector representations: XY coordinates (2), XYZ vectors (3), quaternions (4), etc.
It also indicates the number of samples present in this measurement payload, in steps of power of two (2, 4, 8, 16, 32, etc., samples). This allows for better use of system resources by hashing, signing and encrypting larger sets of data, with only one 12-byte header as additional memory overhead. The 4-bits reserved to indicate that multiple samples are present allows for between 2 and 16384 samples to be stored in the payload (2^n), or an arbitrary value:
0 = 1 sample (default)     8 = 256 samples
1 = 2 samples              9 = 512 samples
2 = 4 samples              10 = 1024 samples
3 = 8 sammples             11 = 2048 samples
4 = 16 samples             12 = 4096 samples
5 = 32 samples             13 = 8192 samples
6 = 64 samples             14 = 16384 samples
7 = 128 samples            15 = Arbitrary (see below)
If the sample count is set to 15 (0xF), the number of samples should be indicated via an unsigned 32-bit integer in little-endian format at the start of the payload, but AFTER the optional timestamp (if present).
This word also contains an 8-bit Source ID field, which allows the measurement value's source to be identified to retrieve further information about the source device out of band, such as it's min/max values, sample rate, gain setting, etc.
In order to minimize endless memcpy operations, and deal with variable length
measurements, all step_measurement records are allocated from a central
heap memory block managed by the sample pool manager.
Allocating and freeing memory imposes a certain amount of rigor on behalf of the developper, and heap memory fragmentation may be an issue over time, but at present this seems like the best tradoff for an initial proof of concept.
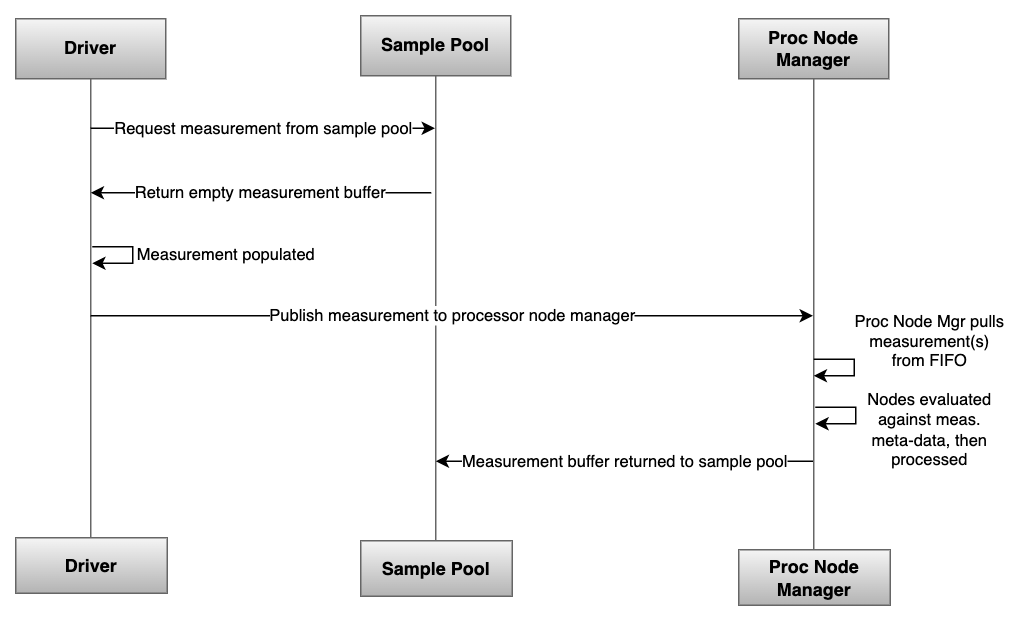
The allocation, population, consumption and release of the measurement packet is describe in the sequence diagram below:
The processor manager makes uses of the .filter word in measurements to
optionally determine if registered filter nodes should or shouldn't process
the incoming measurement value(s).
If the processor node's filter chain is set to NULL (default), it will
accept all incoming measurements. If one or more filters are indicated for the
processor node, the filter engine will evaluate the measurement's filter fields
against the processor node's filter value(s), to determine if there is a match.
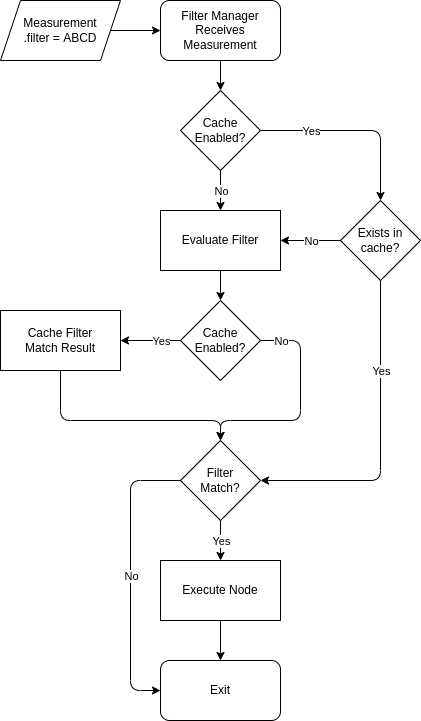
This evaluation process introduces some overhead, which can be addressed by enabling filter caching, which works as follows:


