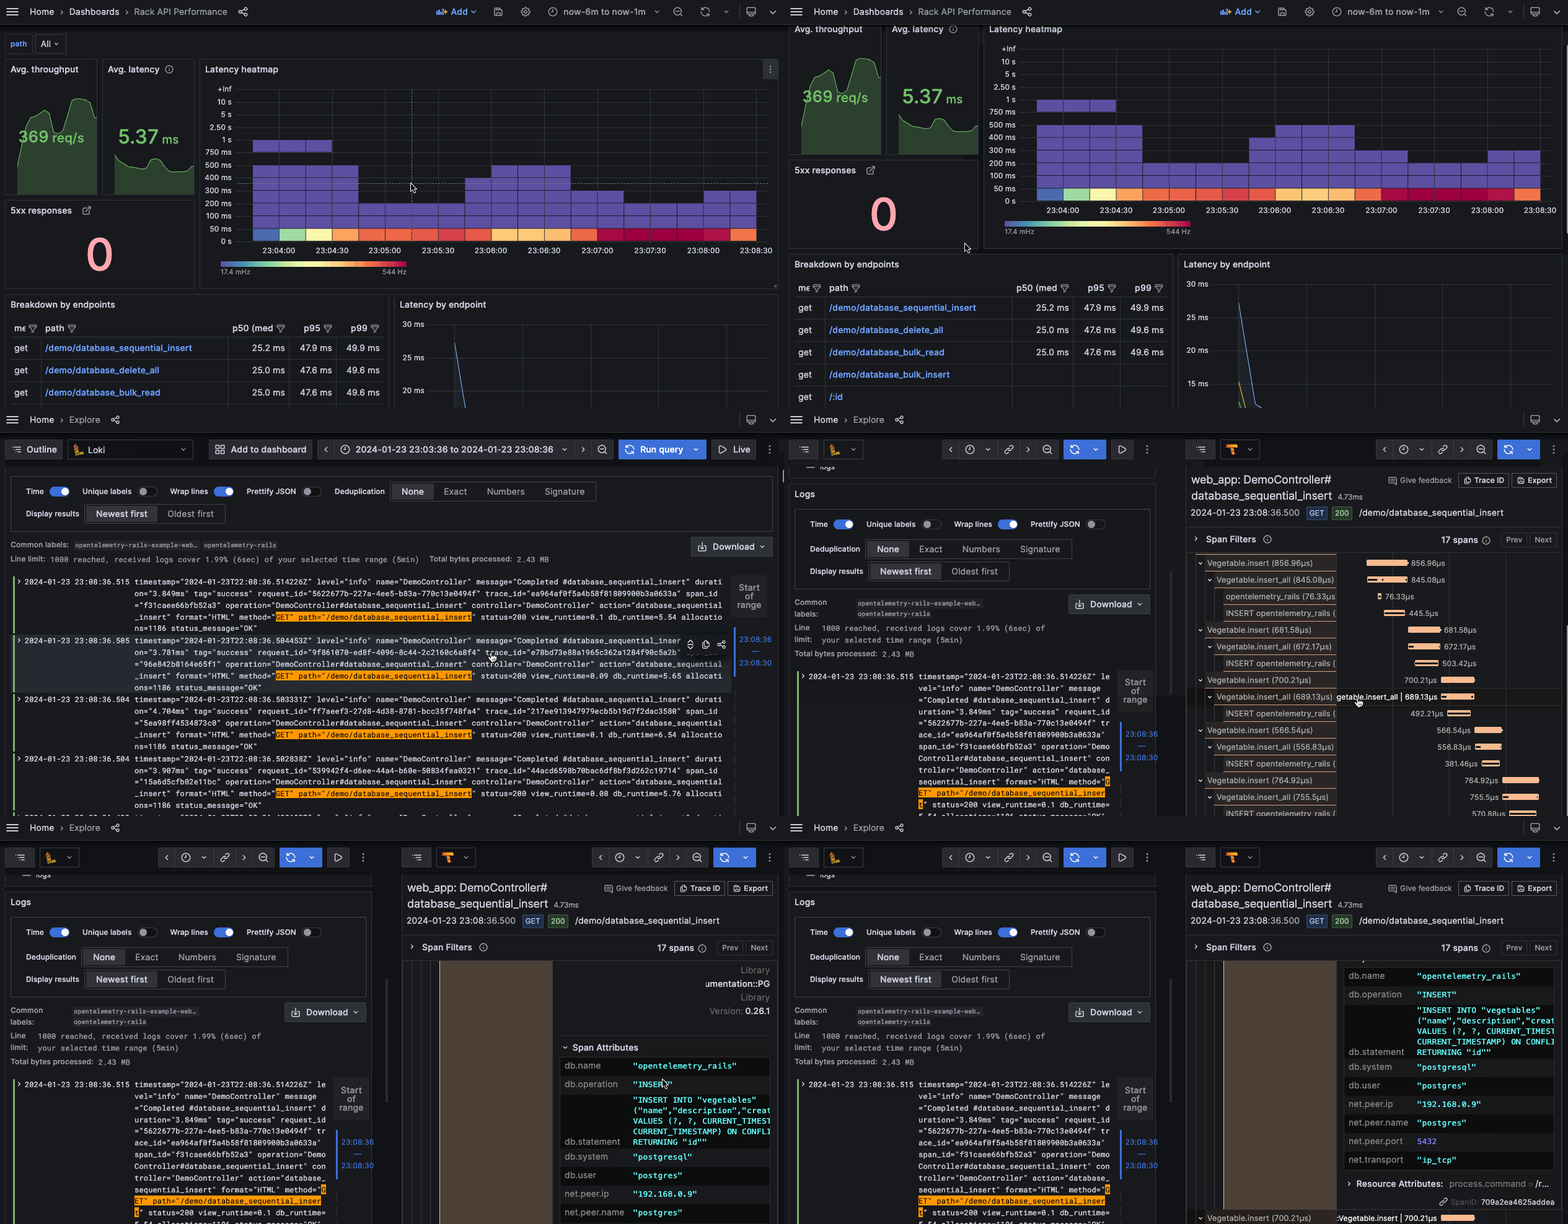
A reference repository for instrumenting Rails apps. It presents what can be achieved using generally available self-hosted software, as opposed to leveraging observability cloud providers. It's suited for testing and debugging, not as a guidance for production setups.
It's opinionated in the way that included libraries and solutions do have alternatives. The main intention though is to stick with Open Source and Open Standards. I'm willing to see suggestions and discussions about different approaches.
The repository is being gradually updated as Open Telemetry SDK and Open Telemetry Contrib Packages for Ruby progress (the Ruby OTel SDK doesn't support metrics and traces yet).
I recommend visiting open-telemetry/opentelemetry-demo for a complete example of instrumentation of a distributed system.
What's being observed:
- Ruby on Rails app (HTTP service)
- Sidekiq app (background processing)
Services used for gathering and accessing telemetry data:
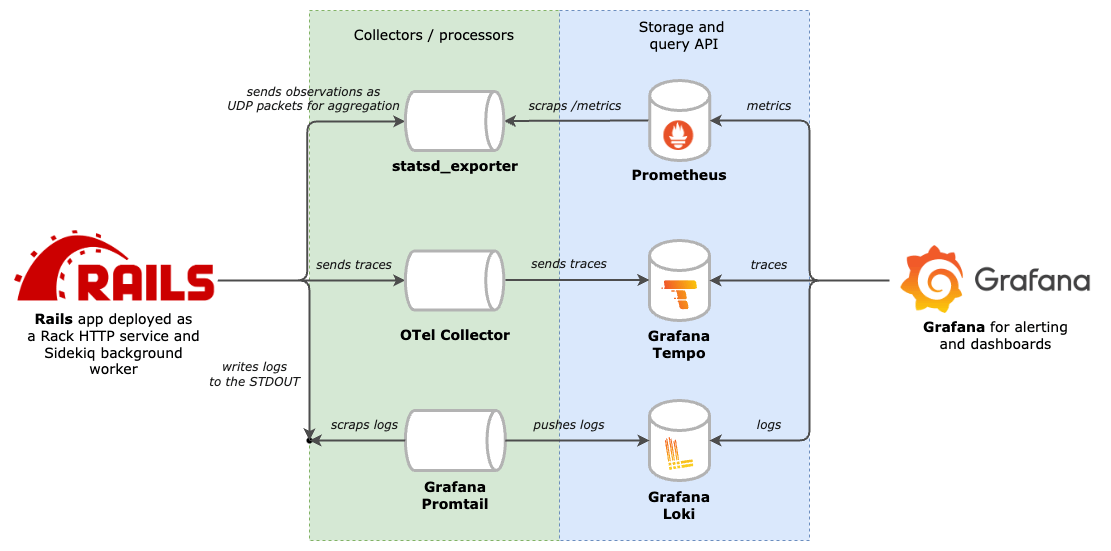
- Promtail and Loki for logs
- OpenTelemetry Collector and Tempo for tracing
- statsd_exporter and Prometheus for metrics
- Grafana for visualization
The rails_semantic_logger gem is used in the Rails app to produce and output logs to the STDOUT. Then, promtail scraps logs from the docker's standard output and pushes them to Loki. Loki stores the logs and makes them available for querying in Grafana.
Logs are outputted in the fmt format. In addition to standard fields, there are extra fields included: request_id, trace_id, span_id and operation.
The Rails app is auto-instrumented with suitable Open Telemetry Contrib packages. The list of all available packages can be found on the OpenTelemetry registry.
Traces produced by the instrumentation are being sent to the OpenTelemetry Collector. Then, OpenTelemetry Collector exports them to Tempo which stores the traces and makes them available for querying in Grafana.
Metrics are emitted in the StatsD style. Currently, the only instrumentation is the statsd-rack-instrument measuring HTTP requests.
Metrics are sent to the statsd_exporter which then aggregates and exposes metrics in the Prometheus format. Prometheus scraps the statsd_exporter, stores and makes metrics available for querying in Grafana.
See a lengthy explanation why this approach is suggested https://mkaz.me/blog/2023/collecting-metrics-from-multi-process-web-servers-the-ruby-case/
The real synergy comes from correlating all the pillars of observability - logs, traces, and metrics - together. It's super convenient to easily navigate from a log to a related trace or even from a spike in metric to a related trace. That's the main motivation behind including Grafana in the stack - a single UI that is capable of presenting and correlating all the data.
-
Siekiq metrics
-
Exemplars to enable metrics <-> traces navigation

