...works only in predefined specific setting. Not robust at all!
As of March 3, 2019 automatic download works for:
- Quandl
- Yahoo Finance
- S&P Dow Jones Indices (https://us.spindices.com)
- BNP (relies on
library(RSelenium)and Firefox Browser, not very stable) - STOXX
- Ossiam
- SIX (various specific parameters implemented in 4 functions)
- ICE
- Vienna
- FTSE
Automatic download no longer works for:
- MSCI Indices (has to be manually downloaded from https://www.msci.com/end-of-day-data-country)
- HFR (has to be downloaded manually from https://www.hedgefundresearch.com/download-hfrx-index-performance-data registration required)
System: Ubuntu 16.04, R 3.5.2, Firefox Quantum 65.0
-
The running
main.Rwill read a spreadsheet fileBasiswerte.xlsx, which predefines the tickers of interest to me. However, the download functions can also be run independently of it. -
For Quandl a API key is required. You can get it in your personal Quandl.com settings. See the setup part of
main.Rto read it. The key could be stored in a filequandlkey.private. -
Error
Error in curl::curl_fetch_disk(url, x$path, handle = handle) : SSL certificate problem: unable to get local issuer certificatecould be solved with https://stackoverflow.com/a/54660072 -
Error
Error in wdman::selenium(port = port, verbose = verbose, version = version, : Selenium server signals port = 4566 is already in use.: no solution found yet, https://stackoverflow.com/a/43993442 didn't help
See in PCA directory. Published on RPubs here: http://rpubs.com/mgei/pca-usecase
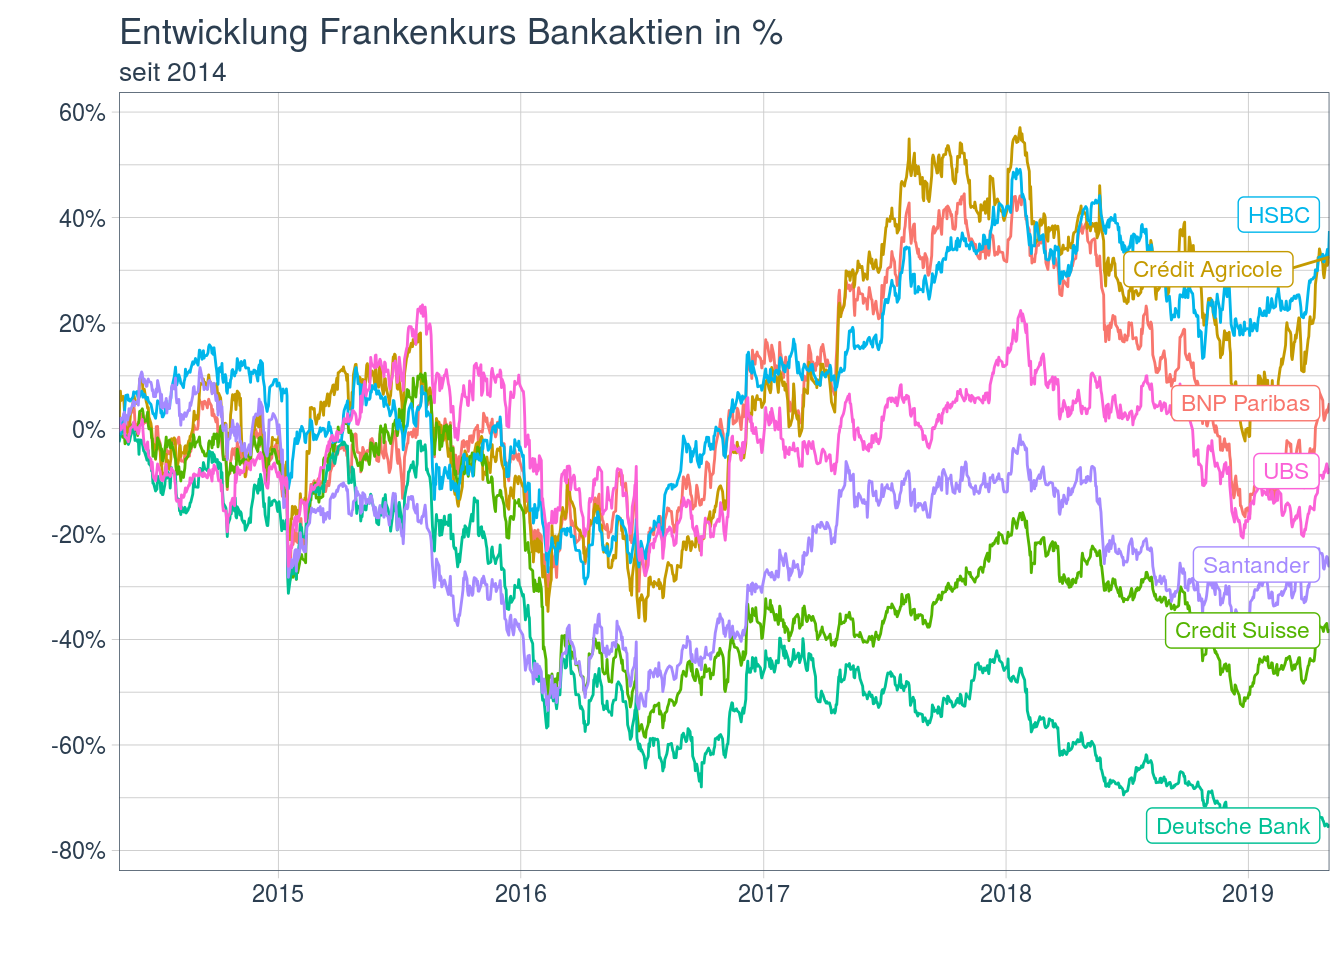
See in european-banks directory. Available on RPubs: http://rpubs.com/mgei/european-banks
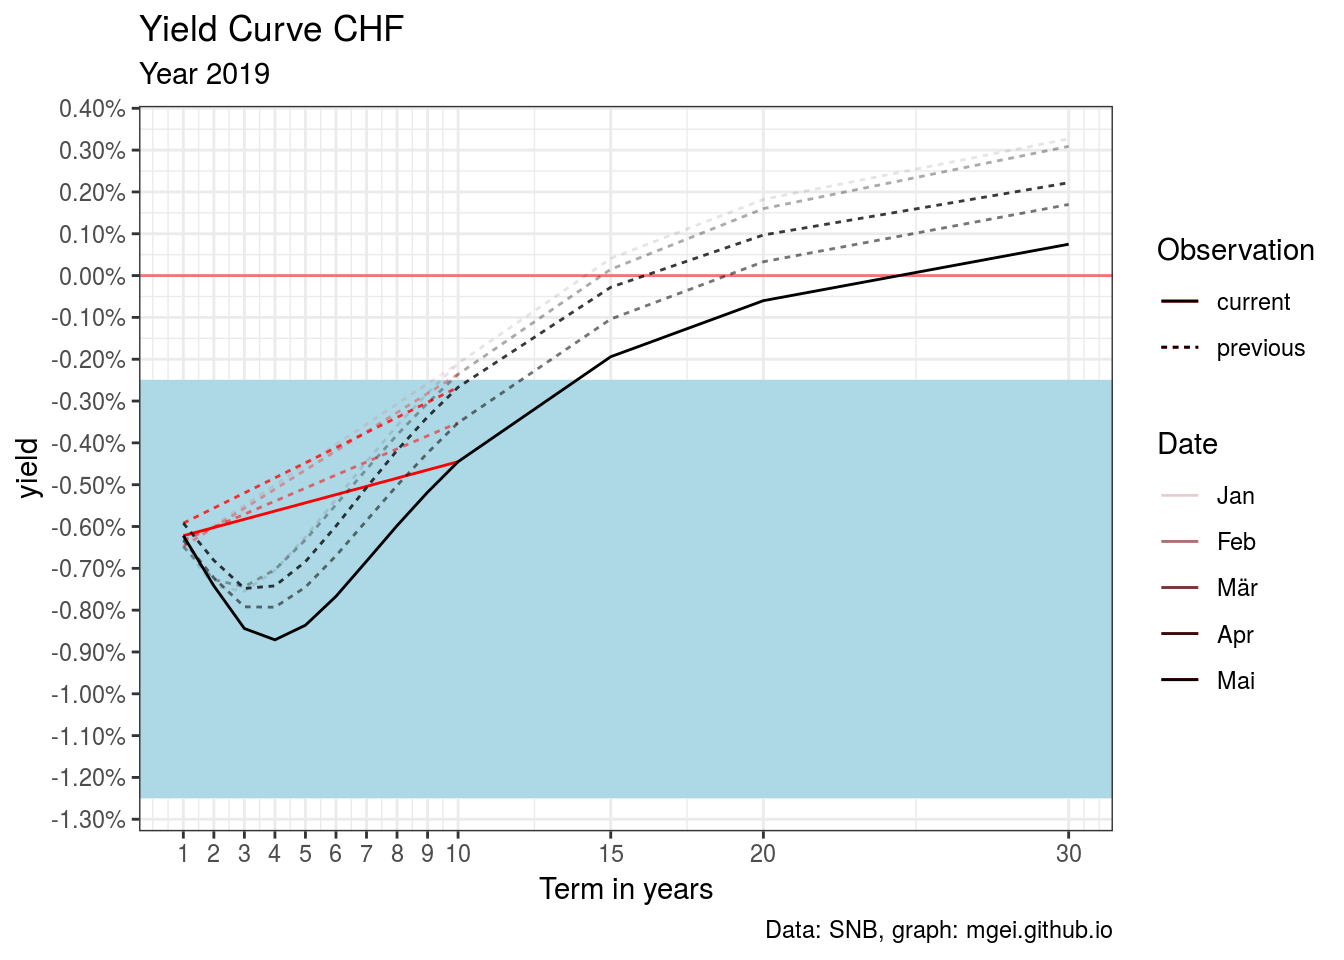
https://mgei.github.io/post/market-june19/
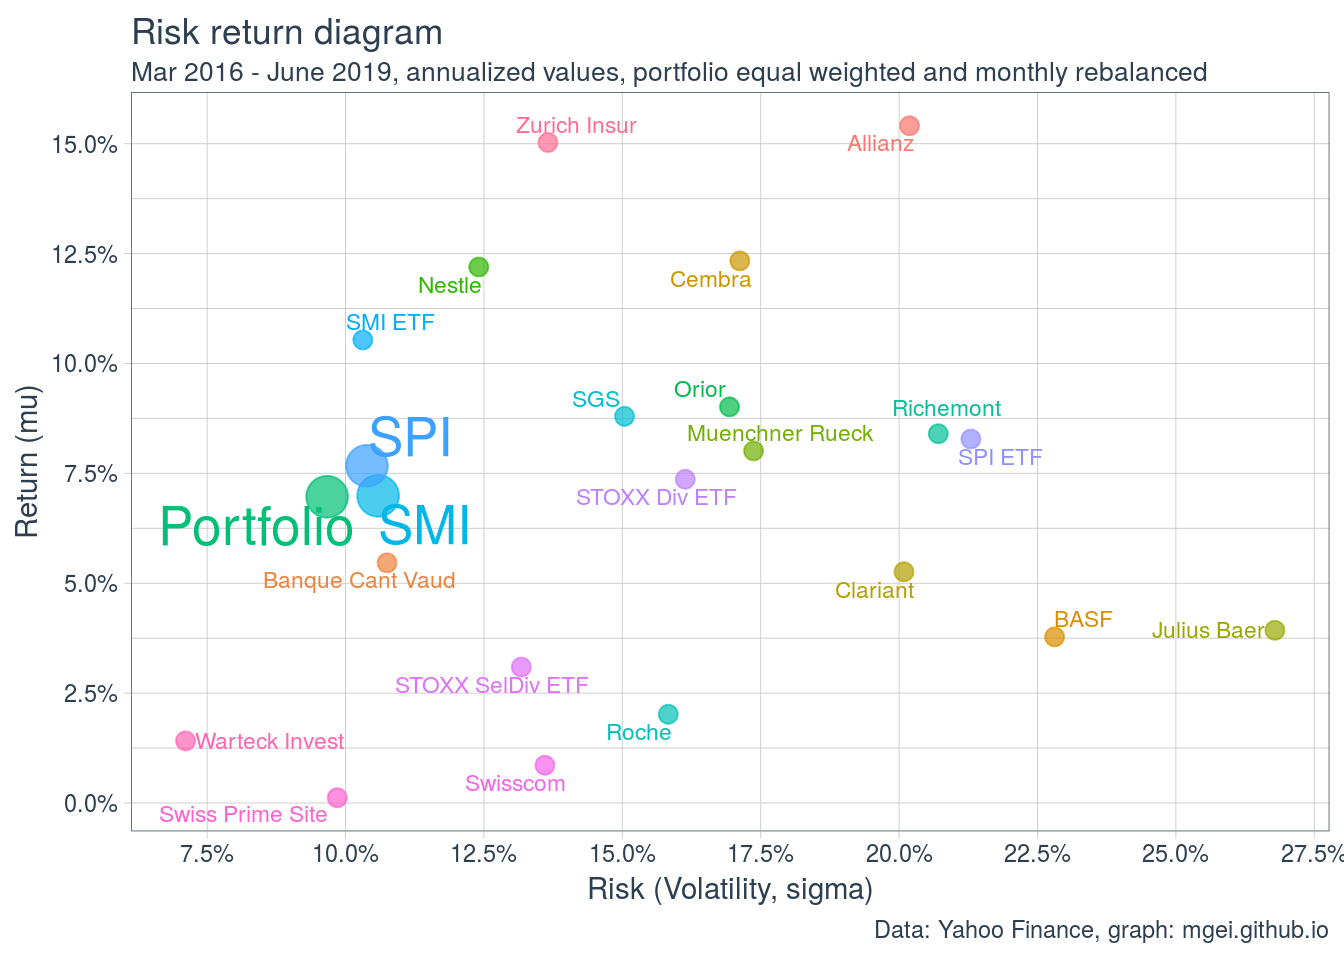
https://mgei.github.io/post/performance-eval/
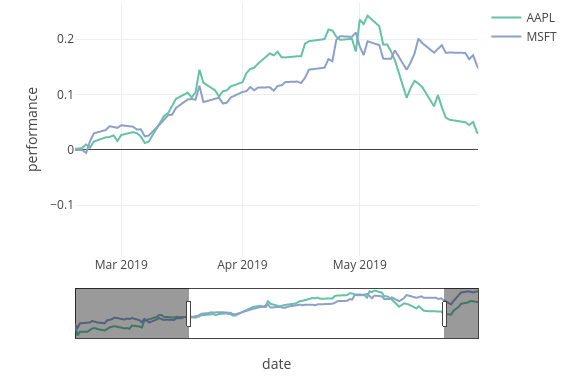
Stackoverflow: https://stackoverflow.com/questions/56551892/using-ggplotly-rangeslider-for-interactive-relative-performance-stock-returns
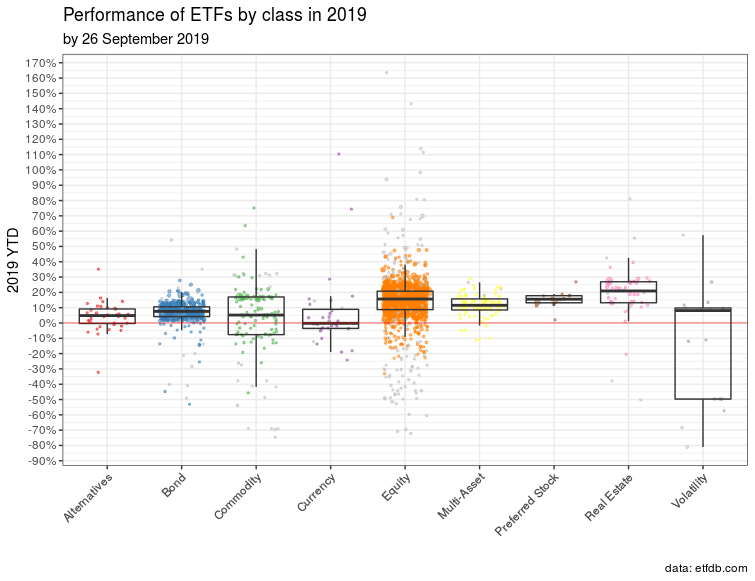
etfdb.com screener is a great tool for finding ETFs. As of today, there are 2290 ETFs listed. I like to sort by total assets, which is default.
Unfortunately, the site uses pagination and things to prevent people from scraping the whole list. I had no chance to get it done from R directly. But I found janlukasschroeder/etfdb-api which provides functions to download the whole list from the screener.
To get it to run:
- Install things if you had never used Node.js or React (like myself)
Follow this if you're on Ubuntu: https://www.techomoro.com/how-to-install-and-setup-a-react-app-on-ubuntu-18-04-1/
curl -sL https://deb.nodesource.com/setup_12.x | sudo -E bash -
sudo apt-get install -y nodejs
sudo npm install npm@latest -g
npm install -g create-react-app
(might need sudo)
- Make a new file
data.js(is this even the file ending one uses for node.js?)
const etfdb = require('etfdb-api');

etfdb
  .listEtfs((perPage = 2290), (page = 1), (sort = 'assets'), (order = 'desc'))
  .then(result => {
    console.log('Total ETFs:', result.meta.total_records);
    console.log('etf.symbol.text, etf.name.text, etf.mobile_title, etf.assets, etf.average_volume, etf.asset_class, etf.ytd');
    result.data.forEach(etf => console.log(etf.symbol.text, ';', etf.name.text, ';', etf.mobile_title, ';', etf.assets, ';', etf.average_volume, ';', etf.asset_class, ';', etf.ytd));
  });
- Run with
node data.jsor actually save the output to a csv with
node data.js > output.csv2
- Import to R
- Install Docker
https://docs.docker.com/install/linux/docker-ce/ubuntu/
- Pull docker image for server
docker pull selenium/standalone-firefox:2.53.0
- Start container server
docker run -d -p 4445:4444 selenium/standalone-firefox:2.53.0
- Back to R
If not already installed do:
install.packages('RSelenium')
install.packages('rvest')
Run etfs/erfdb_selenium.r.
see in swiss-market/get_six.R.
outdated: we found a better way to scrape including price data, see functions in shiny-comparison/setup.R.
WIP
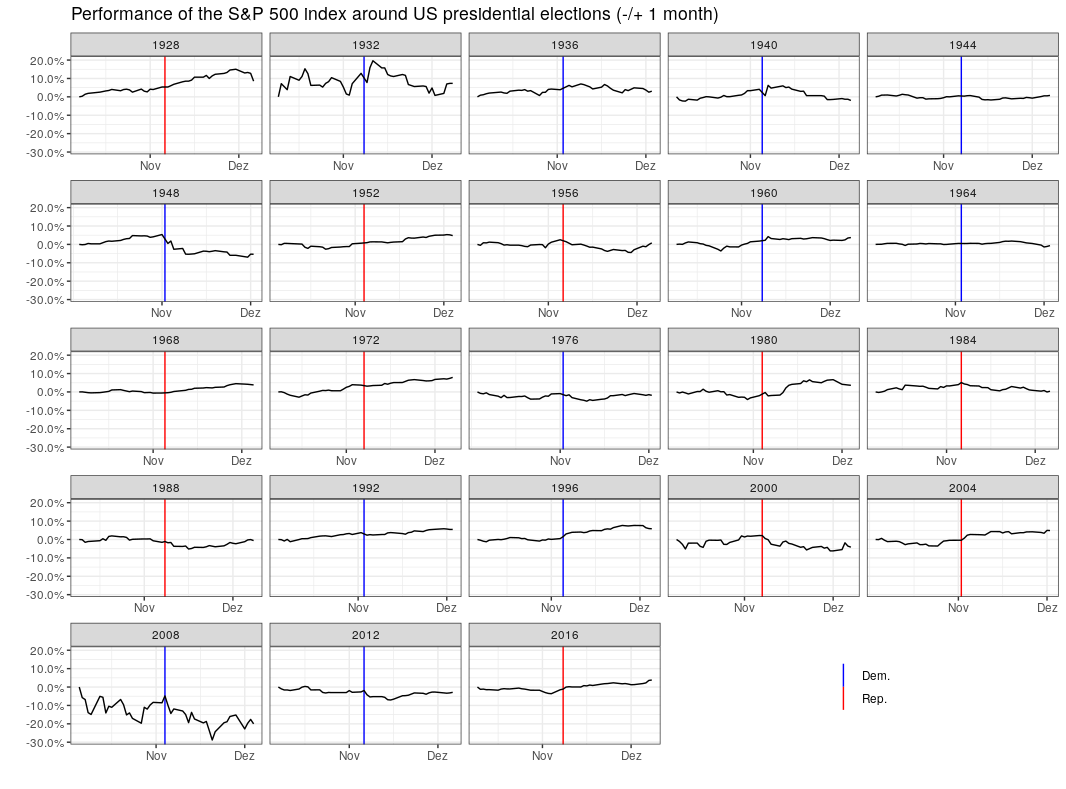
Performance of the S&P500 index around US presidential elections

