Visit the project page for a more detailed look on how the images below were created.
I wanted to get a deeper insight on the current state of things here in Ontario. This is by no means a comprehensive look at all possible models but only the models that I have come across through my readings.
Berry I, Soucy J-PR, Tuite A, Fisman D. Open access epidemiologic data and an interactive dashboard to monitor the COVID-19 outbreak in Canada. CMAJ. 2020 Apr 14;192(15):E420.
-
Trend Analysis:
- Log Regression
- fbProphet
-
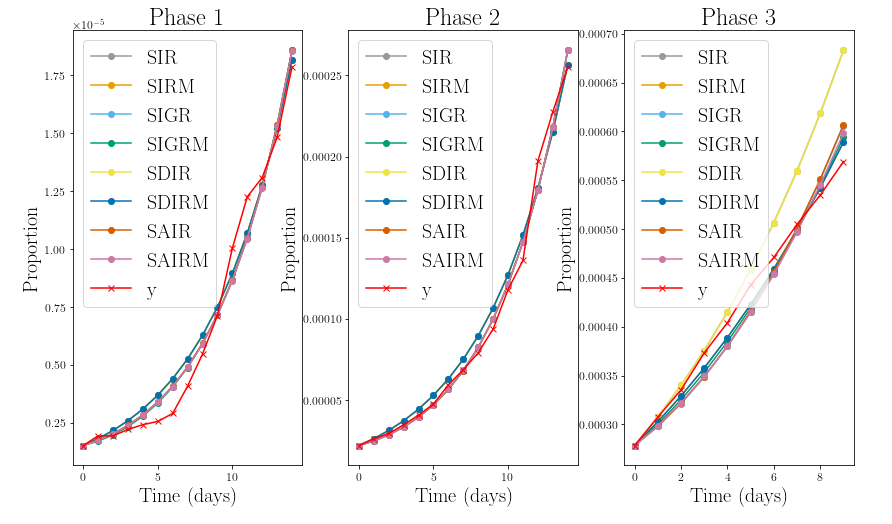
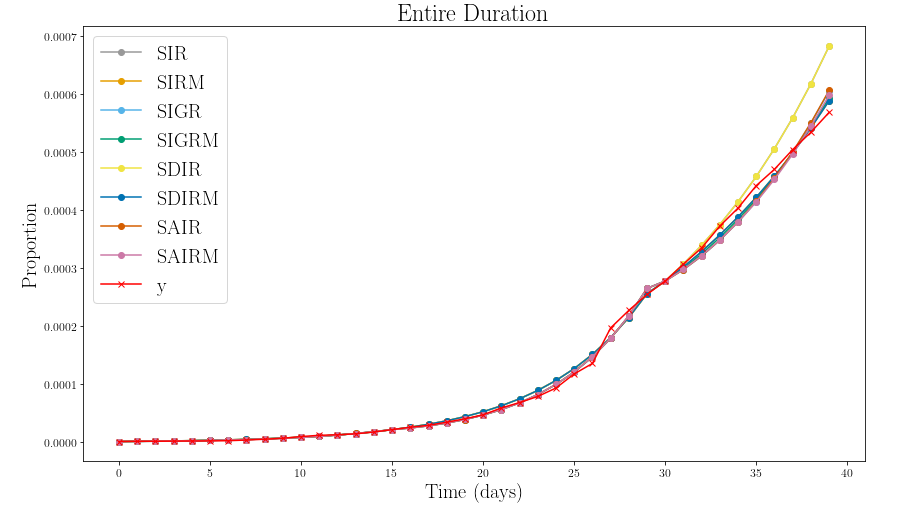
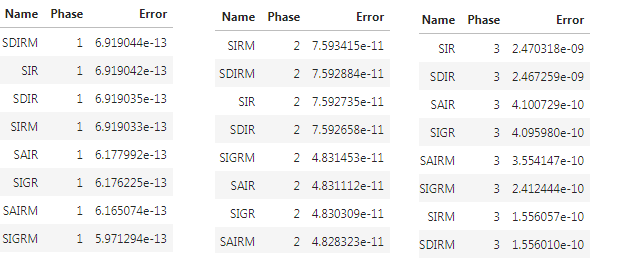
Model Creation:
- SIR(M)
- SAIR(M)
- SDIR(M)
- SIGR(M)
- SEIR(M)
-
Prediction:
- [ ]
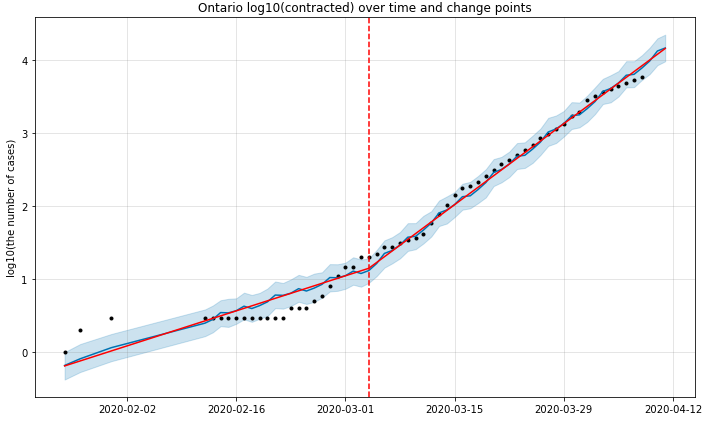
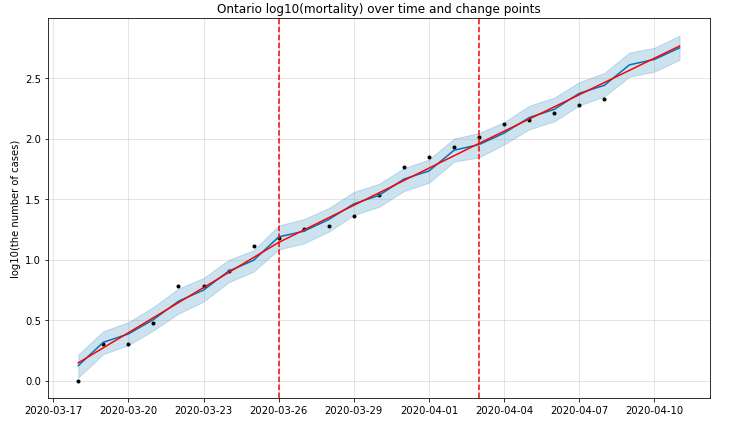
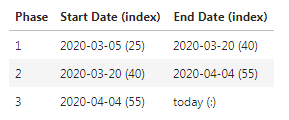
These are the critical dates from the above graph.