📚 This SQL project delves into the fascinating realm of product carbon footprints (PCFs) to explore the environmental impact of various products. The dataset, sourced from nature.com, provides valuable insights into the greenhouse gas emissions associated with different companies and their products. 🌍♻️
🔍 The primary focus of this analysis is to investigate and quantify the carbon footprint of products across different stages of production.
 Photo by Maxim Tolchinskiy on Unsplash
Greenhouse gas emissions attributable to products—from food to sneakers to appliances—make up more than 75% of global emissions. -The Carbon Catalogue
The data, which is publicly available on nature.com, contains product carbon footprints (PCFs) for various companies. PCFs are the greenhouse gas emissions attributable to a given product, measured in CO2 (carbon dioxide equivalent).
This data is stored in a PostgreSQL database containing one table, product_emissions, which looks at PCFs by product as well as the stage of production these emissions occurred in. Here's a snapshot of what product_emissions contains in each column:
| field | data_type |
|---|---|
| id | VARCHAR |
| year | INT |
| product_name | VARCHAR |
| company | VARCHAR |
| country | VARCHAR |
| industry_group | VARCHAR |
| weight_kg | NUMERIC |
| carbon_footprint_pcf | NUMERIC |
| upstream_percent_total_pcf | VARCHAR |
| operations_percent_total_pcf | VARCHAR |
| downstream_percent_total_pcf | VARCHAR |
Steps:
- 🔢 Count the total number of records in the "product_emissions" table, revealing 866 entries.
- 📋 Retrieve and display a snapshot of the dataset, sorted in descending order based on the year.
- 📈 Explore various columns, including product name, company, country, industry group, weight in kilograms, carbon footprint (PCF), and percentages of emissions at different stages.
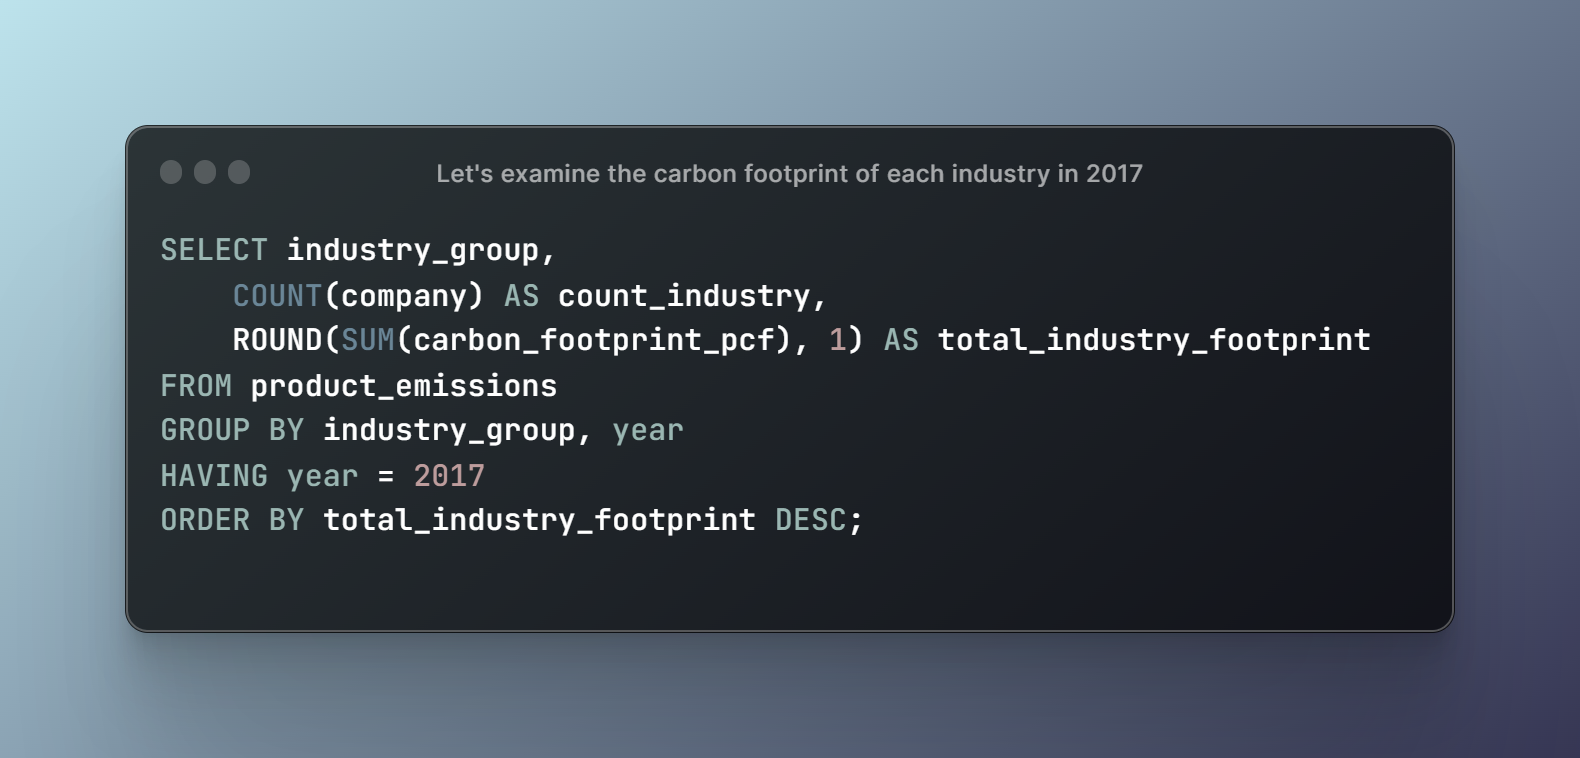
- 🔍 Conduct a grouped analysis based on industry group and year, filtering for the year 2017.
- 🧮 Calculate the count of companies in each industry group and the total carbon footprint (PCF) rounded to one decimal place.
- 🔢 Sort the results in descending order based on the total industry footprint.
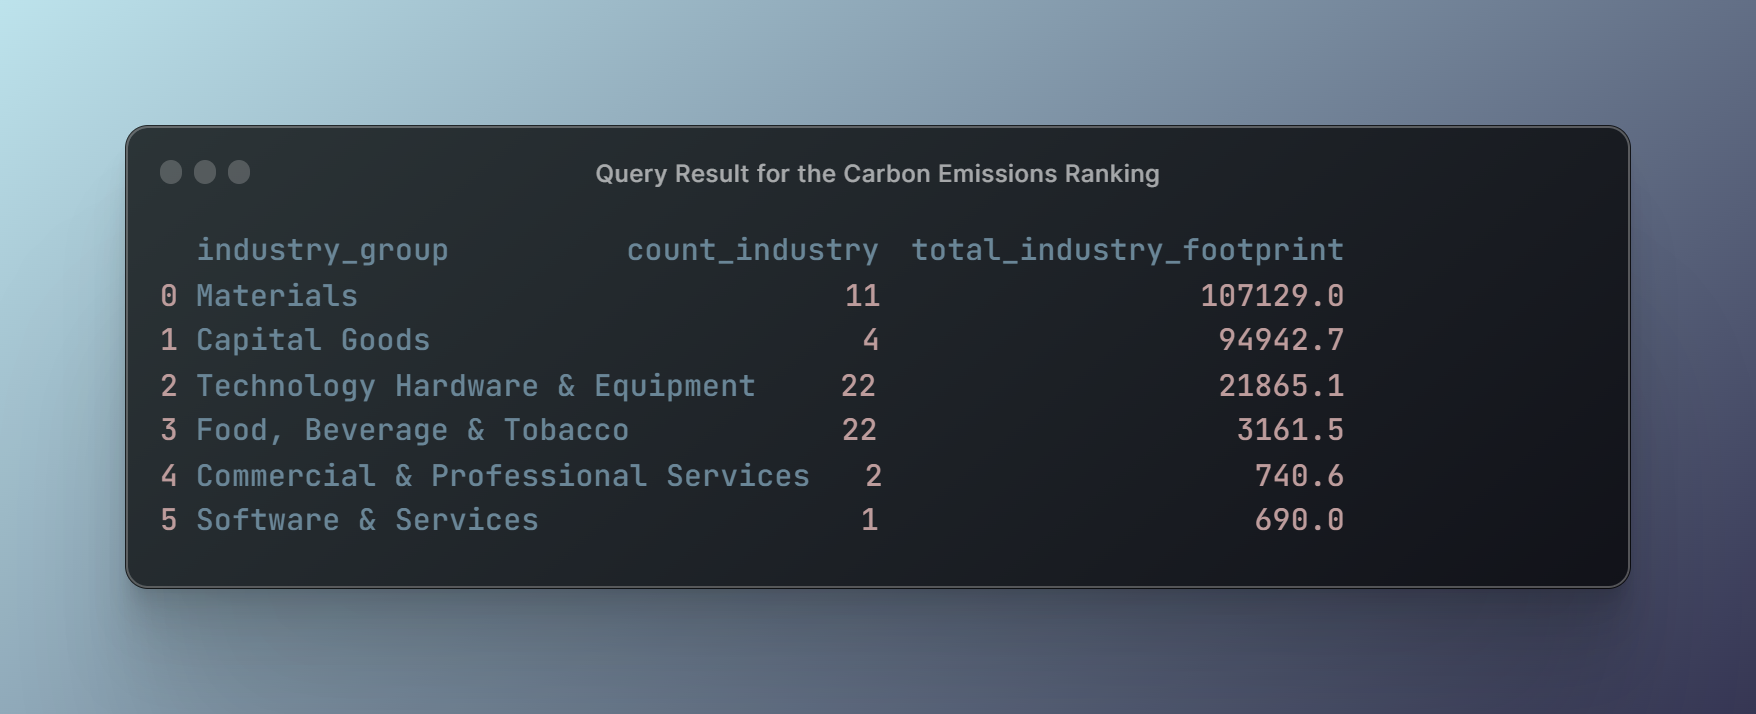
- 💡 Uncover insights such as the Materials industry having 11 companies with a total carbon footprint of 107,129.0, followed by Capital Goods with 4 companies and a footprint of 94,942.7.
- 🌍♻️ The project aims to raise awareness about product carbon footprints and promote environmentally conscious practices across industries. By leveraging SQL analysis techniques, we can contribute to a more sustainable future for our planet. 🌱🔍
| industry_group | count_industry | total_industry_footprint |
|---|---|---|
| Materials | 11 | 107,129.0 |
| Capital Goods | 4 | 94,942.7 |
| Technology Hardware & Equipment | 22 | 21,865.1 |
| Food, Beverage & Tobacco | 22 | 3,161.5 |
| Commercial & Professional Services | 2 | 740.6 |
| Software & Services | 1 | 690.0 |
Based on the analysis of the product carbon footprints in 2017, the industries with the highest total carbon footprints are:
- Materials with a total footprint of 107,129.0
- Capital Goods with a total footprint of 94,942.7
- Technology Hardware & Equipment with a total footprint of 21,865.1
On the other hand, the industries with relatively lower total carbon footprints are:
- Food, Beverage & Tobacco with a total footprint of 3,161.5
- Commercial & Professional Services with a total footprint of 740.6
- Software & Services with a total footprint of 690.0
The SQL queries used in this project can be found in the jupyter notebook file.
To examine the carbon footprint of each industry in the dataset, the following SQL query was used:

