This is my collection of Tikz art.
\begin{tikzpicture}[
    level distance=8mm, sibling distance=10mm
    ]
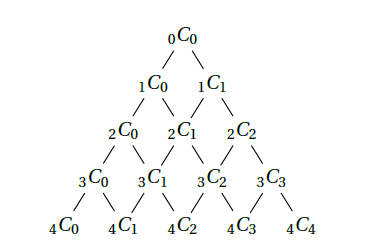
    \node{${}_0C_0$}
    child { node {${}_1C_0$}
        child { node {${}_2C_0$}
            child { node {${}_3C_0$}
                child { node{${}_4C_0$} }
                child { node{${}_4C_1$} }
            }
            child { node {${}_3C_1$}
                child { node {\phantom{3}} }
                child { node {${}_4C_2$} }
            }
        }
        child { node {${}_2C_1$}
            child { node {\phantom{3}} }
            child { node {${}_3C_2$}
                child { node{\phantom{6}} }
                child { node{${}_4C_3$} }
            }
        }
    }
    child { node {${}_1C_1$}
        child { node {\phantom{2}} }
        child { node {${}_2C_2$}
            child { node {\phantom{3}} }
            child { node {${}_3C_3$}
                child { node{\phantom{4}} }
                child { node{${}_4C_4$} }
            }
        }
    };
\end{tikzpicture}\begin{tikzpicture}[
level distance=8mm, sibling distance=10mm
]
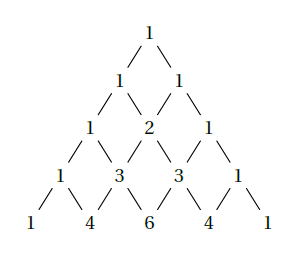
\node{1}
child { node {1}
child { node {1}
child { node {1}
child { node{1} }
child { node{4} }
}
child { node {3}
child { node {\phantom{3}} }
child { node {6} }
}
}
child { node {2}
child { node {\phantom{3}} }
child { node {3}
child { node{\phantom{6}} }
child { node{4} }
}
}
}
child { node {1}
child { node {\phantom{2}} }
child { node {1}
child { node {\phantom{3}} }
child { node {1}
child { node{\phantom{4}} }
child { node{1} }
}
}
};
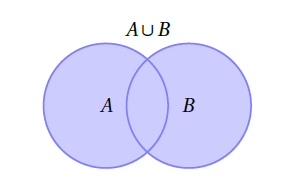
\end{tikzpicture}\def\firstcircle{(0,0) circle (1.5cm)}
\def\secondcircle{(0:2cm) circle (1.5cm)}
\colorlet{circle edge}{blue!50}
\colorlet{circle area}{blue!20}
\tikzset{filled/.style={fill=circle area, draw=circle edge, thick}, outline/.style={draw=circle edge, thick}}
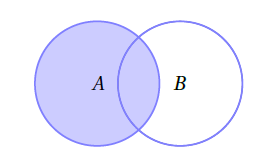
\begin{tikzpicture}[scale=.7]
\draw[filled] \firstcircle node {$A$};
\draw \secondcircle node {$B$};
\draw[outline] \secondcircle;
\end{tikzpicture}
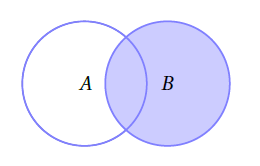
\begin{tikzpicture}[scale=.7]
\draw \firstcircle node {$A$};
\draw[filled] \secondcircle node {$B$};
\draw[outline] \firstcircle;
\end{tikzpicture}
\begin{tikzpicture}[scale=.7]
\draw[filled] \firstcircle node {$A$}
\secondcircle node {$B$};
\node[anchor=south] at (current bounding box.north) {$A\cup B$};
\end{tikzpicture}
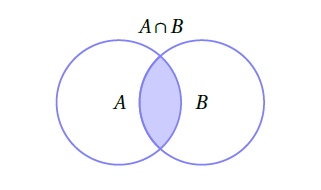
\begin{tikzpicture}[scale=.7]
\begin{scope}
\clip \firstcircle;
\fill[filled] \secondcircle;
\end{scope}
\draw[outline] \firstcircle node {$A$};
\draw[outline] \secondcircle node {$B$};
\node[anchor=south] at (current bounding box.north) {$A \cap B$};
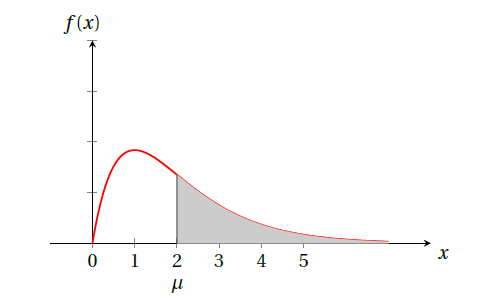
\end{tikzpicture}\begin{tikzpicture}
\begin{axis}[
width=8cm, height=5cm,
samples=200,
minor x tick num = 0,
minor y tick num = 0,
axis x line=bottom,
axis y line=middle,
xmin=-1, xmax=8,
ymin=0, ymax=0.8,
xlabel=$x$, ylabel=$f(x)$,
xlabel style={at={(1,0)}, anchor=north west},
ylabel style={rotate=0, at={(0.15,1)}, anchor=south east},
xtick={0,1,2,3,4,5},
ytick={},
yticklabels={}
]
\addplot[red,thick,domain=0:7,name path=g1] {x*exp(-x)};
\path[name path=l1] (2,0) -- (2,10);
\path[name intersections={of=g1 and l1}];
\addplot[gray,domain=2:7,draw=none,fill=gray!40]{x*exp(-x)} \closedcycle;
\draw (intersection-1) -- (2,0);
%\draw (2,0) node[below]{$\mu$};
\end{axis}
\draw (2.15,-0.5) node[below]{$\mu$};
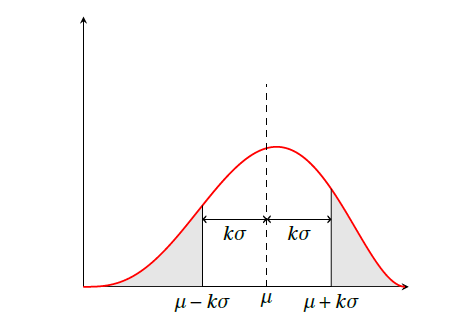
\end{tikzpicture}\begin{tikzpicture}[domain=0:1,samples=200,scale=0.8]
\begin{axis}[%
minor tick num = 0,
% axis x line = bottom,
% axis y line = none,
axis lines=middle,
% axis line style=thick,
xmin=0, xmax=1.01,
ymin=0, ymax=4.0,
ticks=none,
% xlabel=$x$,
every axis x label/.style={at={(current axis.right of origin)},anchor=north west},
clip=false
]
\addplot [smooth, red, thick, name path=f] {betapdf(x,4,3)};
\path[name path=axis] (axis cs:0,0) -- (axis cs:1,0);
% \addplot [domain=0:0.5,smooth, blue, thick,fill=gray!20] {betapdf(x,4,3)} \closedcycle;
\addplot [fill=gray,fill opacity=0.2] fill between[of=f and axis,soft clip={domain=0.0:0.57-0.2}];
\addplot [fill=gray,fill opacity=0.2] fill between[of=f and axis,soft clip={domain=0.57+0.2:1}];
\path (0.57,0) coordinate (MX);
\path (0.57,3) coordinate (MY);
\path ($(MX)+(-0.2,0)$) coordinate (X1);
\path ($(MY)+(-0.2,0)$) coordinate (Y1);
\path ($(MX)+(0.2,0)$) coordinate (X2);
\path ($(MY)+(0.2,0)$) coordinate (Y2);
\draw[dashed] (MX) node[below]{$\mu$} -- (MY);
\path[name path=l] (X1) -- (Y1);
\path[name intersections={of=f and l}];
\path (intersection-1) coordinate (A);
\draw (X1) node[below]{$\mu-k\sigma$} -- (A);
\path[name path=l] (X2) -- (Y2);
\path[name intersections={of=f and l}];
\path (intersection-1) coordinate (A);
\draw (X2) node[below]{$\mu+k\sigma$} -- (A);
\draw[<->] ($(X1)+(0,1)$) -- node[below]{$k\sigma$} ($(MX)+(0,1)$);
\draw[<->] ($(MX)+(0,1)$) -- node[below]{$k\sigma$} ($(X2)+(0,1)$);
\end{axis}
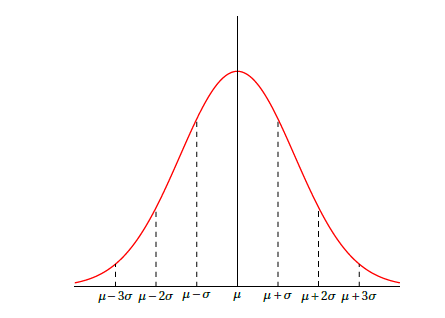
\end{tikzpicture}\begin{tikzpicture}[domain=-4:4,samples=200,scale=0.8]
\begin{axis}[%
% enlarge x limits=false,
minor tick num = 0,
% axis x line = bottom,
% axis y line = none,
% axis lines=middle,
% axis line style=thick,
axis lines=none,
xmin=-4.0, xmax=4.0,
ymin=0, ymax=0.5,
ticks=none,
% xlabel=$x$,
every axis x label/.style={at={(current axis.right of origin)},anchor=north west},
clip=false
]
\addplot [smooth, red, thick, name path=f] {normpdf(x,0,1)};
\path (0,0) coordinate (MX);
\path (0,0.5) coordinate (MY);
\path (-1,0) coordinate (X1);
\path (-1,0.5) coordinate (Y1);
\path (1,0) coordinate (X2);
\path (1,0.5) coordinate (Y2);
\path (-2,0) coordinate (X3);
\path (-2,0.5) coordinate (Y3);
\path (2,0) coordinate (X4);
\path (2,0.5) coordinate (Y4);
\path (-3,0) coordinate (X5);
\path (-3,0.5) coordinate (Y5);
\path (3,0) coordinate (X6);
\path (3,0.5) coordinate (Y6);
\draw (-4,0) -- (4,0);
\draw (0,0) -- (0,0.5);
\draw (MX) node[below]{\footnotesize$\mu$};
\path[name path=l] (X1) -- (Y1);
\path[name intersections={of=f and l}];
\path (intersection-1) coordinate (A1);
\draw[dashed] (X1) node[below]{\footnotesize$\mu-\sigma$} -- (A1);
\path[name path=l] (X2) -- (Y2);
\path[name intersections={of=f and l}];
\path (intersection-1) coordinate (A2);
\draw[dashed] (X2) node[below]{\footnotesize$\mu+\sigma$} -- (A2);
\path[name path=l] (X3) -- (Y3);
\path[name intersections={of=f and l}];
\path (intersection-1) coordinate (A3);
\draw[dashed] (X3) node[below]{\footnotesize$\mu-2\sigma$} -- (A3);
\path[name path=l] (X4) -- (Y4);
\path[name intersections={of=f and l}];
\path (intersection-1) coordinate (A4);
\draw[dashed] (X4) node[below]{\footnotesize$\mu+2\sigma$} -- (A4);
\path[name path=l] (X5) -- (Y5);
\path[name intersections={of=f and l}];
\path (intersection-1) coordinate (A5);
\draw[dashed] (X5) node[below]{\footnotesize$\mu-3\sigma$} -- (A5);
\path[name path=l] (X6) -- (Y6);
\path[name intersections={of=f and l}];
\path (intersection-1) coordinate (A6);
\draw[dashed] (X6) node[below]{\footnotesize$\mu+3\sigma$} -- (A6);
\end{axis}
\end{tikzpicture}