pauvre: a plotting package designed for nanopore reads
This package currently hosts one script for plotting.
pauvre marginplot- takes a fastq file as input and outputs a marginal histogram with a heatmap.
- transparency is the default
Updates:
- 20170529 - added automatic scaling to the input fastq file. It scales to show the highest read quality and the top 99th percentile of reads by length.
Requirements
- You must have the following installed on your system to install this software:
- python 3.x
- matplotlib
- biopython
- pandas
- pillow
Installation
- Instructions to install on your mac or linux system. Not sure on
Windows! Make sure python 3 is the active environment before
installing.
git clone https://github.com/conchoecia/pauvre.gitcd ./pauvrepip3 install .
- Or, install with pip
pip3 install pauvre
Usage
stats- generate basic statistics about the fastq file. For example, if I
want to know the number of bases and reads with AT LEAST a PHRED
score of 5 and AT LEAST a read length of 500, run the program as below
and look at the cells highlighted with
<braces>.pauvre marginplot --fastq miniDSMN15.fastq
- generate basic statistics about the fastq file. For example, if I
want to know the number of bases and reads with AT LEAST a PHRED
score of 5 and AT LEAST a read length of 500, run the program as below
and look at the cells highlighted with
numReads: 1000
numBasepairs: 1029114
meanLen: 1029.114
medianLen: 875.5
minLen: 11
maxLen: 5337
N50: 1278
L50: 296

                      Basepairs >= bin by mean PHRED and length
minLen       Q0       Q5     Q10     Q15   Q17.5    Q20  Q21.5   Q25  Q25.5  Q30
     0  1029114  1010681  935366  429279  143948  25139   3668  2938   2000    0
   500   984212  <968653> 904787  421307  142003  24417   3668  2938   2000    0
  1000   659842   649319  616788  300948  103122  17251   2000  2000   2000    0
 et cetera...
              Number of reads >= bin by mean Phred+Len
minLen    Q0   Q5  Q10  Q15  Q17.5  Q20  Q21.5  Q25  Q25.5  Q30
     0  1000  969  865  366    118   22      3    2      1    0
   500   873 <859> 789  347    113   20      3    2      1    0
  1000   424  418  396  187     62   11      1    1      1    0
 et cetera...
marginplot- automatically calls
pauvre statsfor each fastq file - Make the default plot showing the 99th percentile of longest reads
pauvre marginplot --fastq miniDSMN15.fastq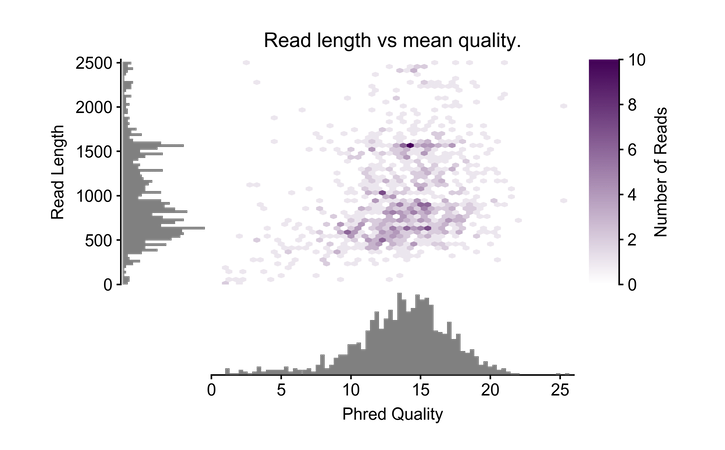
- Make a marginal histogram for ONT 2D or 1D^2 cDNA data with a
lower maxlen and higher maxqual.
pauvre marginplot --maxlen 4000 --maxqual 25 --lengthbin 50 --fileform pdf png --qualbin 0.5 --fastq miniDSMN15.fastq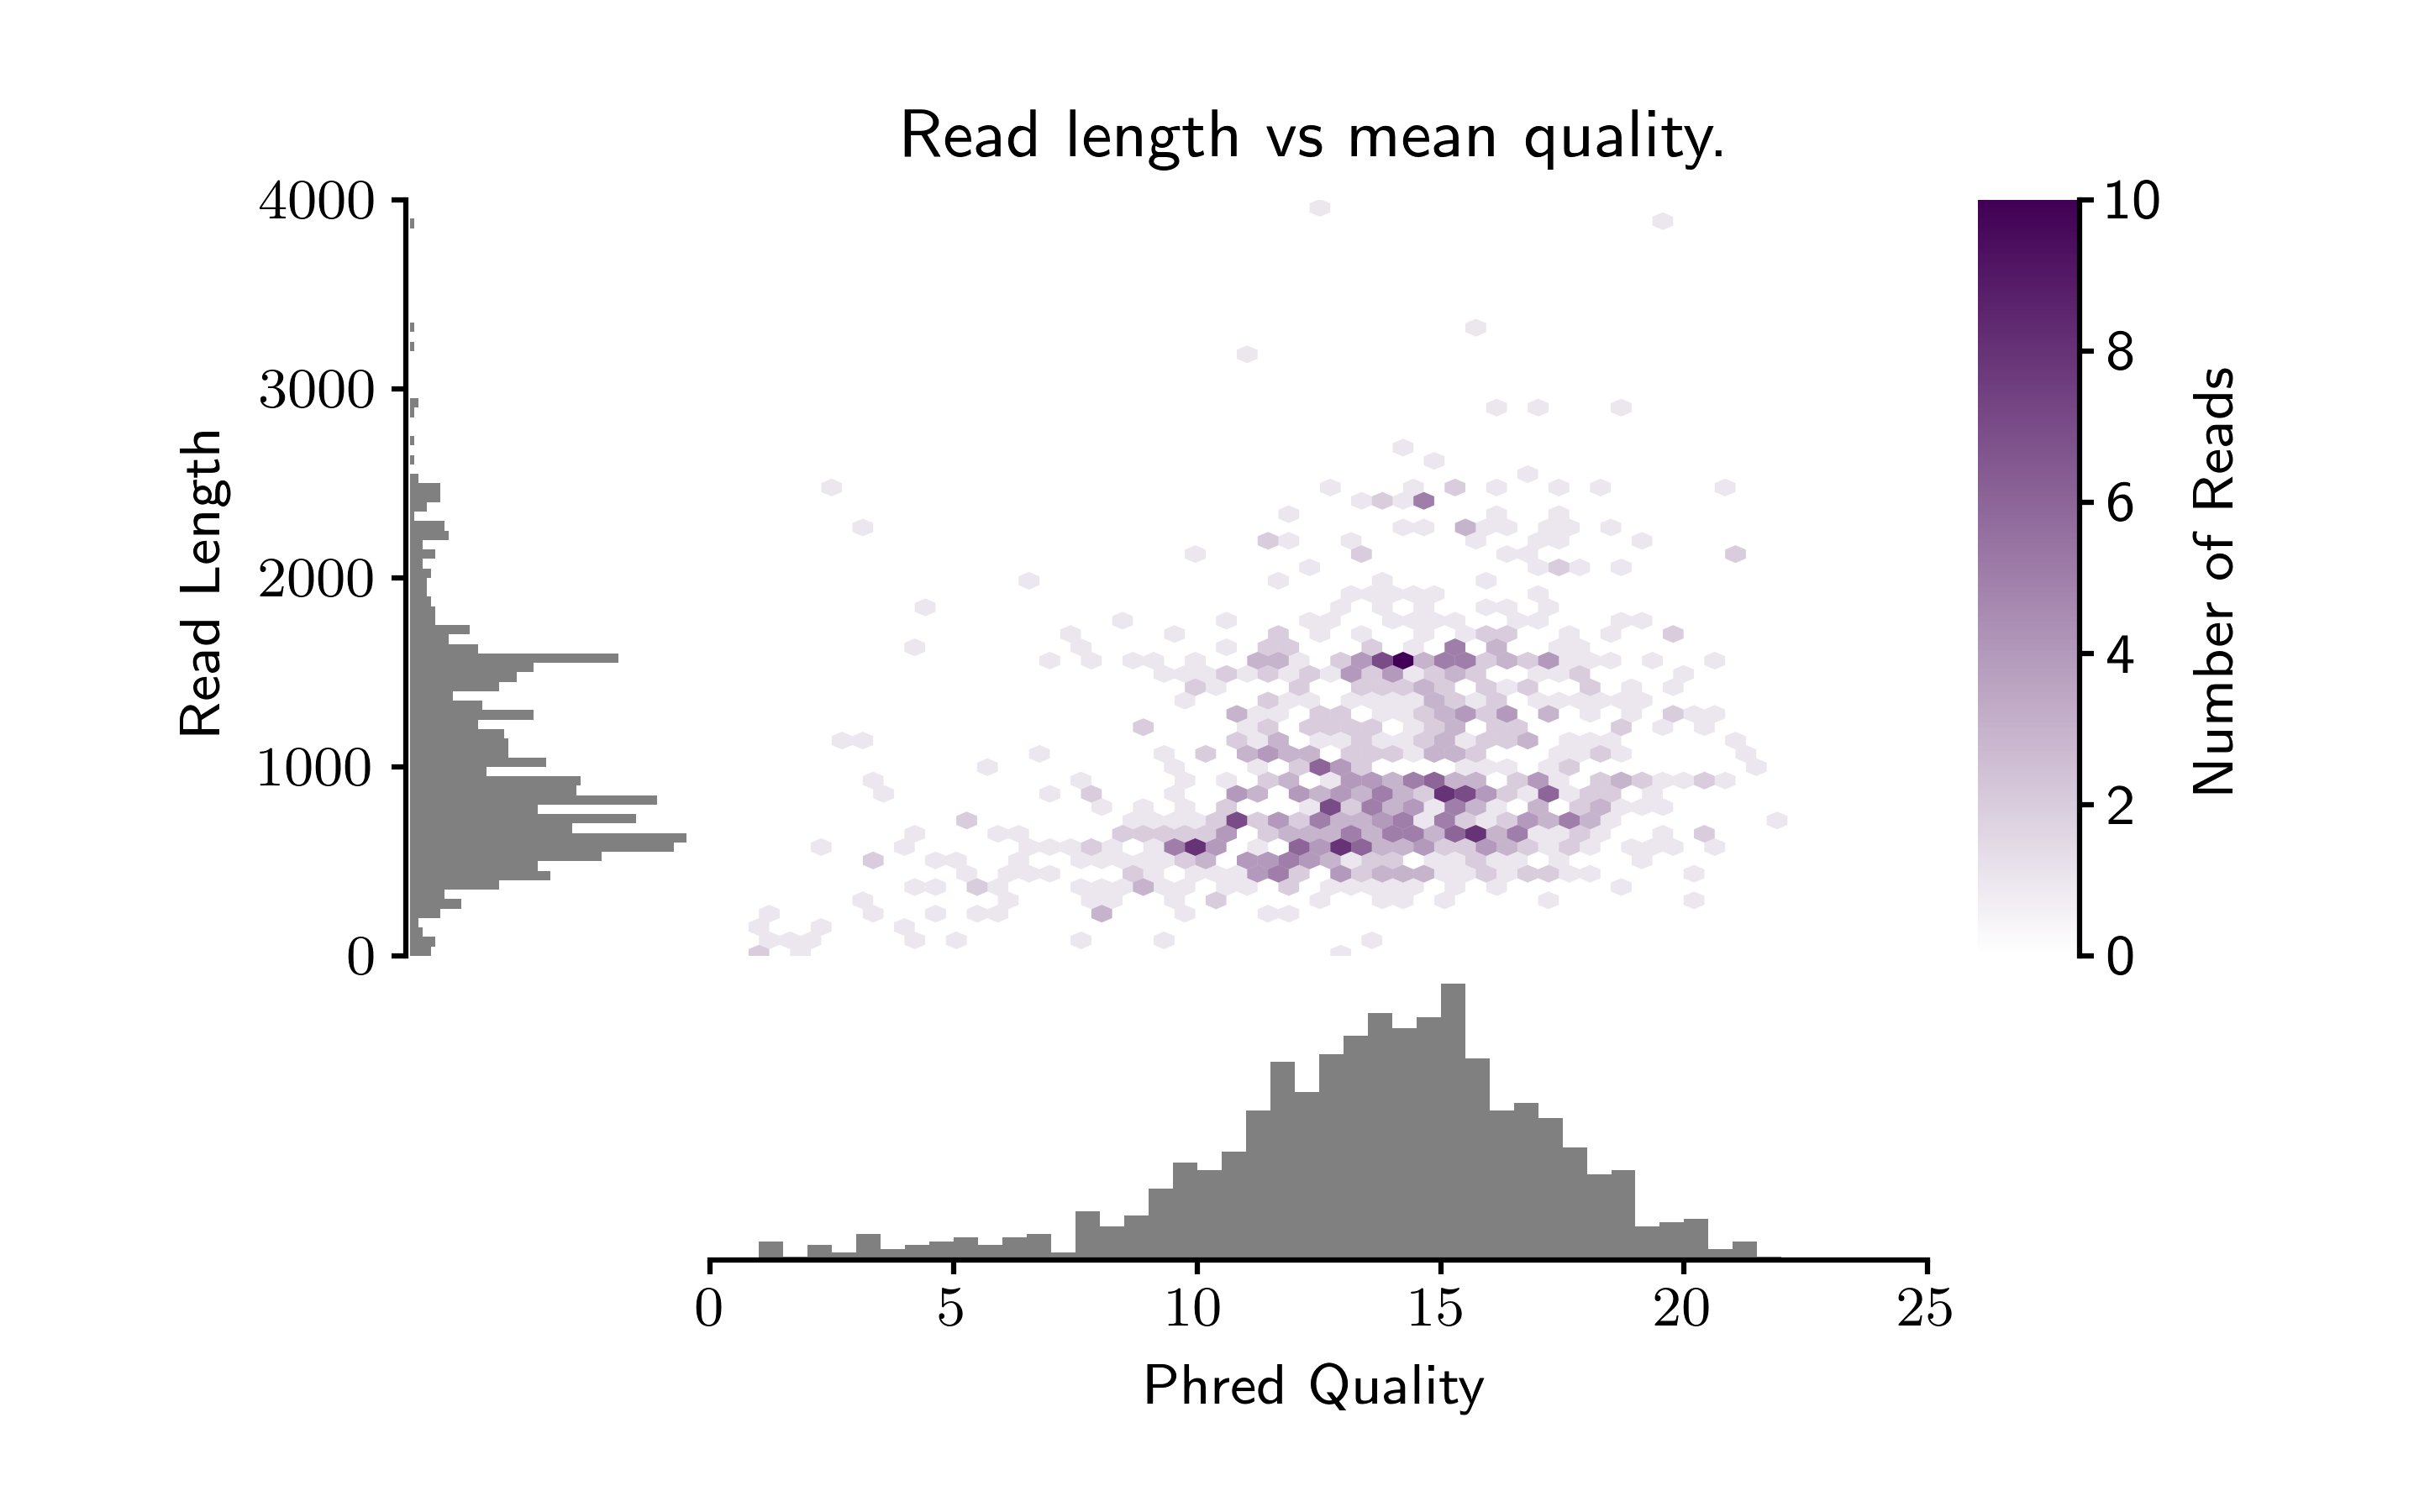
- Plot ONT 1D data with a large tail
pauvre marginplot --maxlen 100000 --maxqual 15 --lengthbin 500 <myfile>.fastq
- Get more resolution on lengths
pauvre marginplot --maxlen 100000 --lengthbin 5 <myfile>.fastq
- Turn off transparency if you just want a white background
pauvre marginplot --transparent False <myfile>.fastq- Note: transparency is the default behavior
- automatically calls


Contributors
@conchoecia (Darrin Schultz) @mebbert (Mark Ebbert)