Visualization of CGP Grey's 1-in-a-million rock paper series
Why?
I thought it would be cool. I also wanted to see how many videos there were
How?
Built using Sveltekit and Cytoscape. Video data was scraped directly from YouTube's website since the API does not support endscreens.
Where?
What?
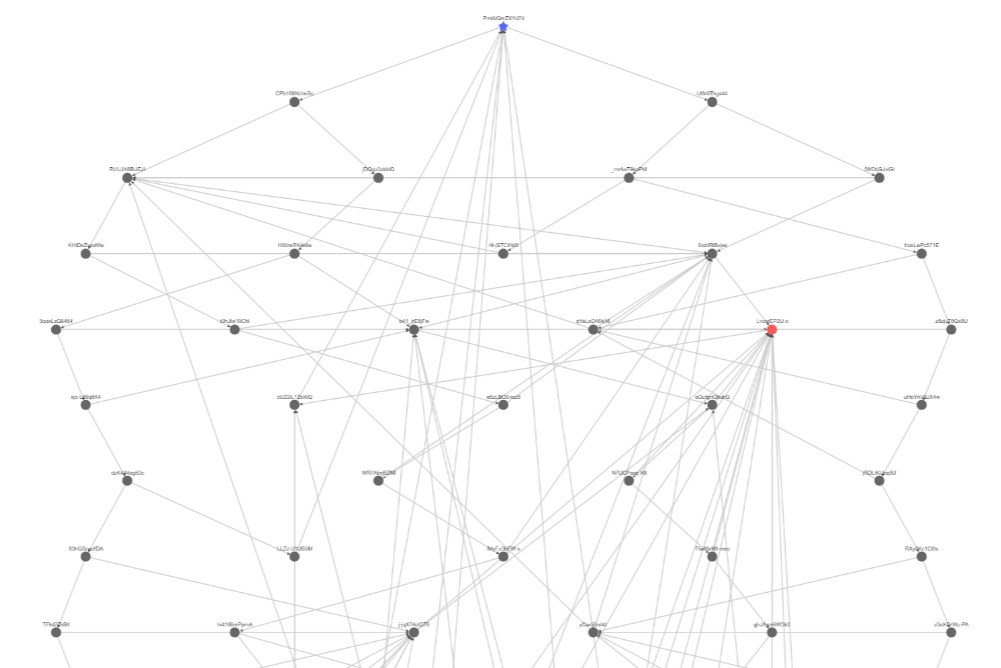
Here's what the graph looks like: