This repository contains one python script and a few R scripts for the quick analysis of stackexchange sites. The analysis uses the publicly available information on http://stackexchange.com/sites, containing the following statistics for each site:
- Number of users
- Number of question
- Number of answers
- Percentage of questions marked as answered
- Link to site
In addition, the questions page of each site is downloaded (two downloads, actually) in order to extract the date of the first question. This date identifies the age of the site.
Note: For my view of the legality of this undertaking please see the section Legal.
Stackexchange (http://stackexchange.com/) was founded in 2008 as a question-answer site for computer programming questions. In the early days it was called Stack Overflow. The success of the site lead the founders to branch out beyond computer programming questions and apply their model to other topics. Now more than hundred such topics are covered.
Since stackoverflow is the oldest of the Stackexchange sites it is also the one with the most users and answers. The following has a very quick analysis of the relationships between:
- the number of users,
- the number of questions asked,
- the number of answers given,
- the percentage of questions marked as answered, and
- the age of the site (years since first question asked).
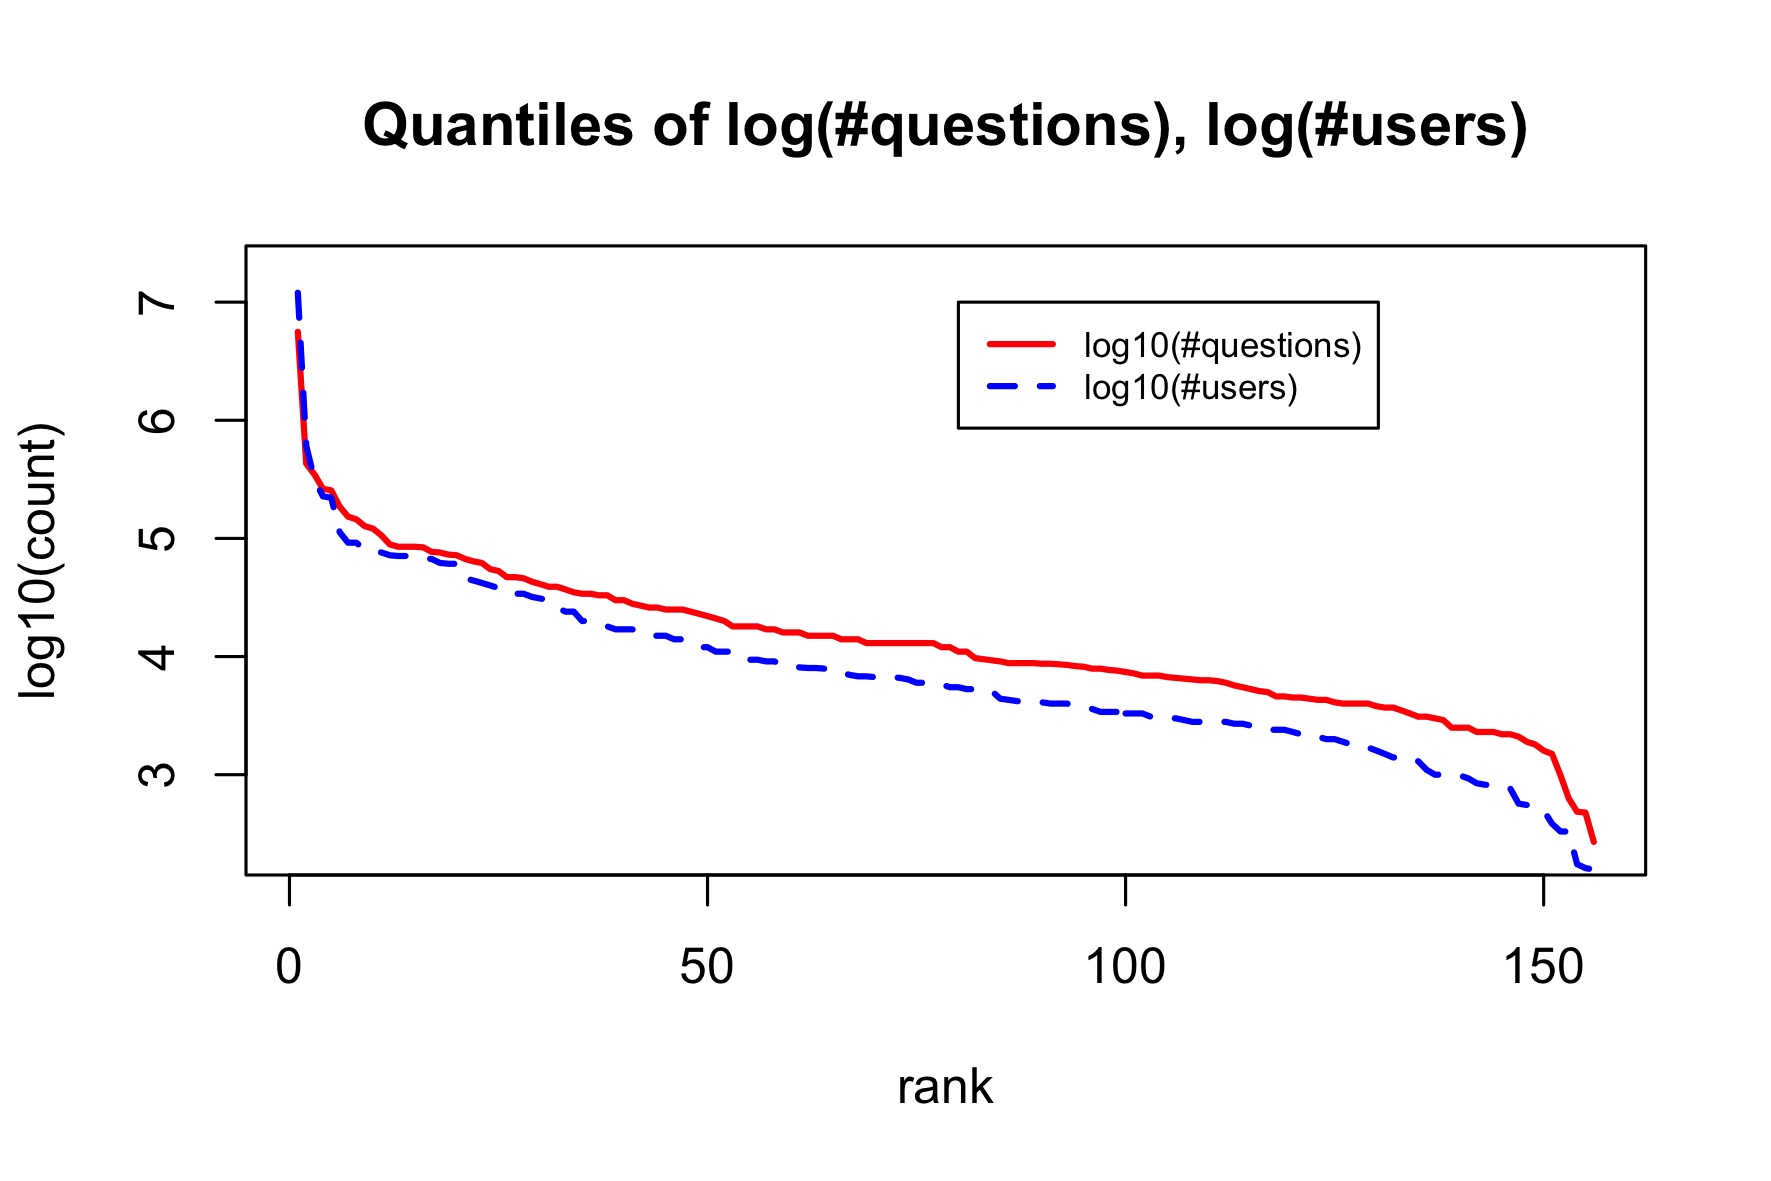
Stackoverflow dominates the whole Stackexchange ecosystem. By any of the extensive measures (#users, #questions, #answers) Stackoverflow is more than ten times bigger than the next biggest (Super User).
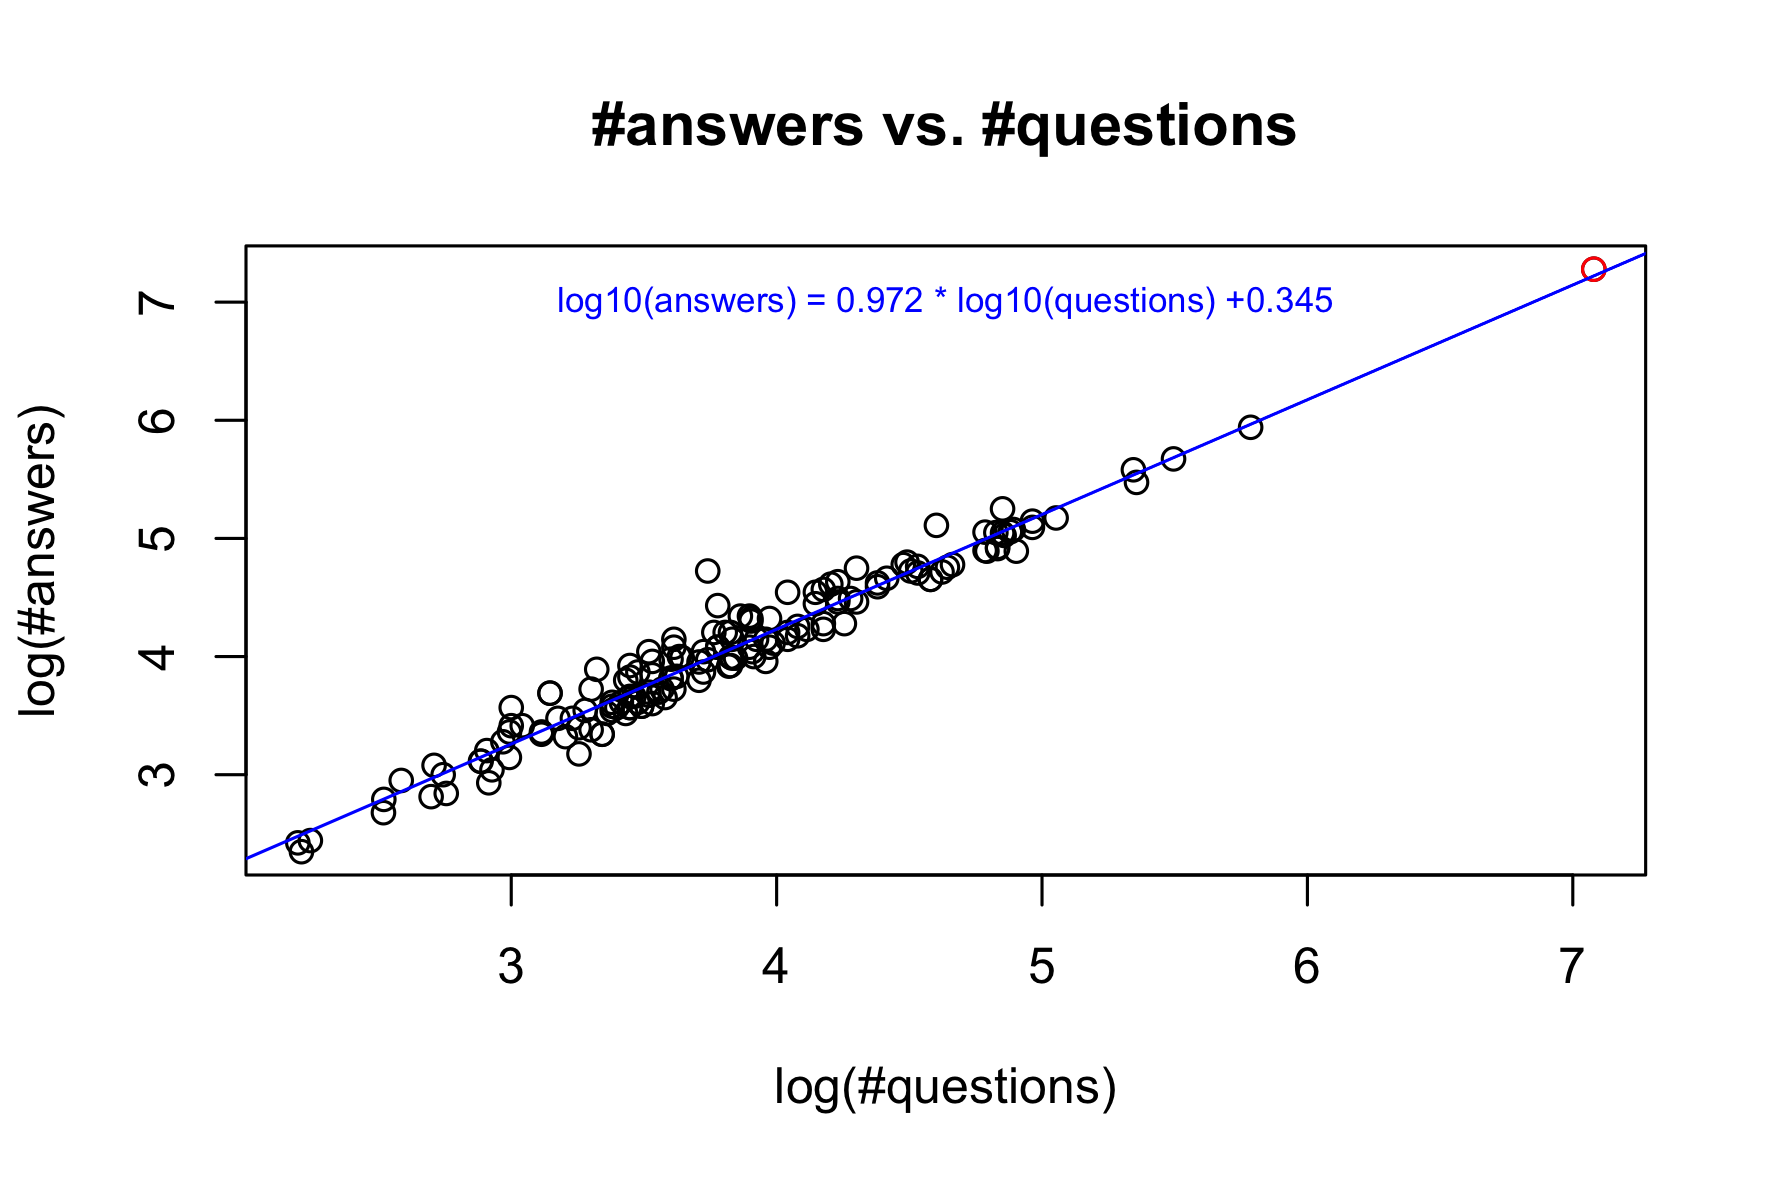
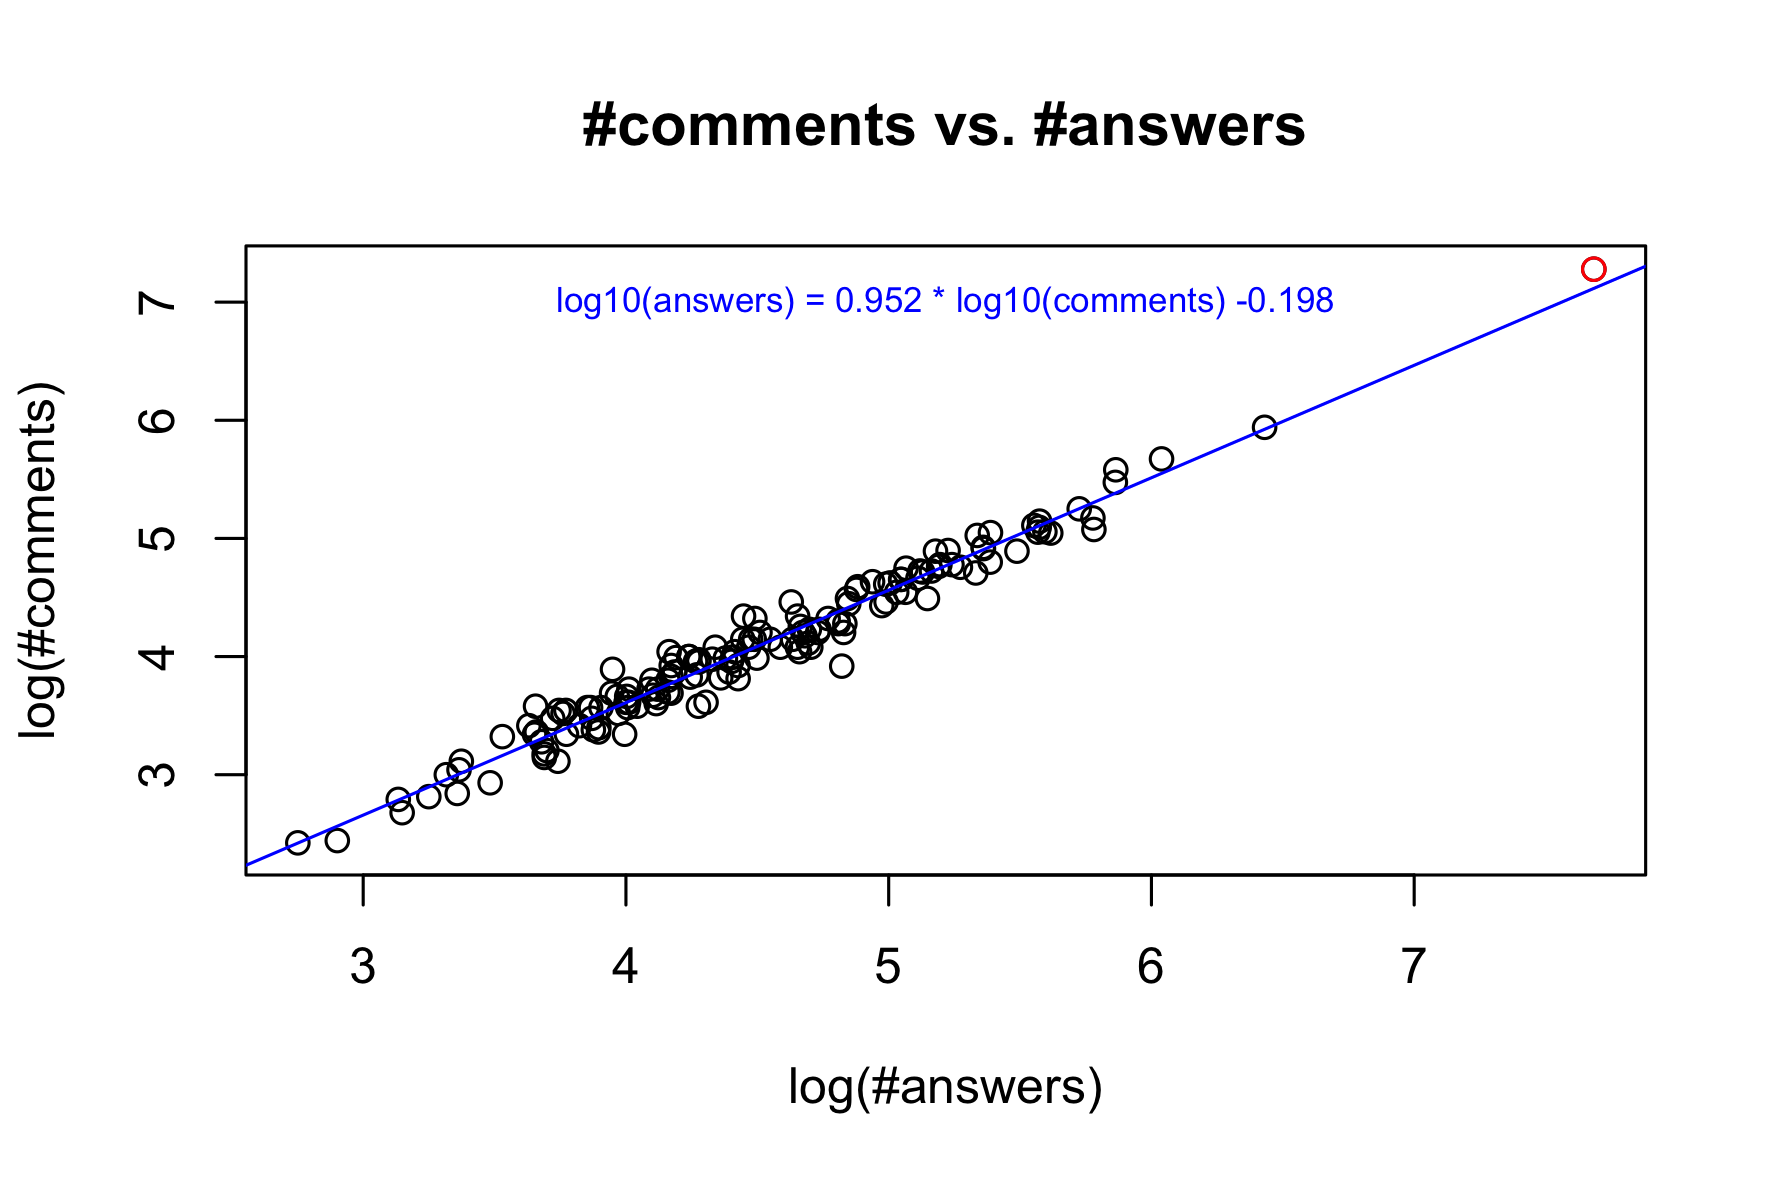
The relationships are analysed in log-log space. Linearity in log-log implies a power law,
log(y) = a log(x) + b => y = C xa, with C>0So if the regression coefficient a=1 the relationship is linear with zero intercept.
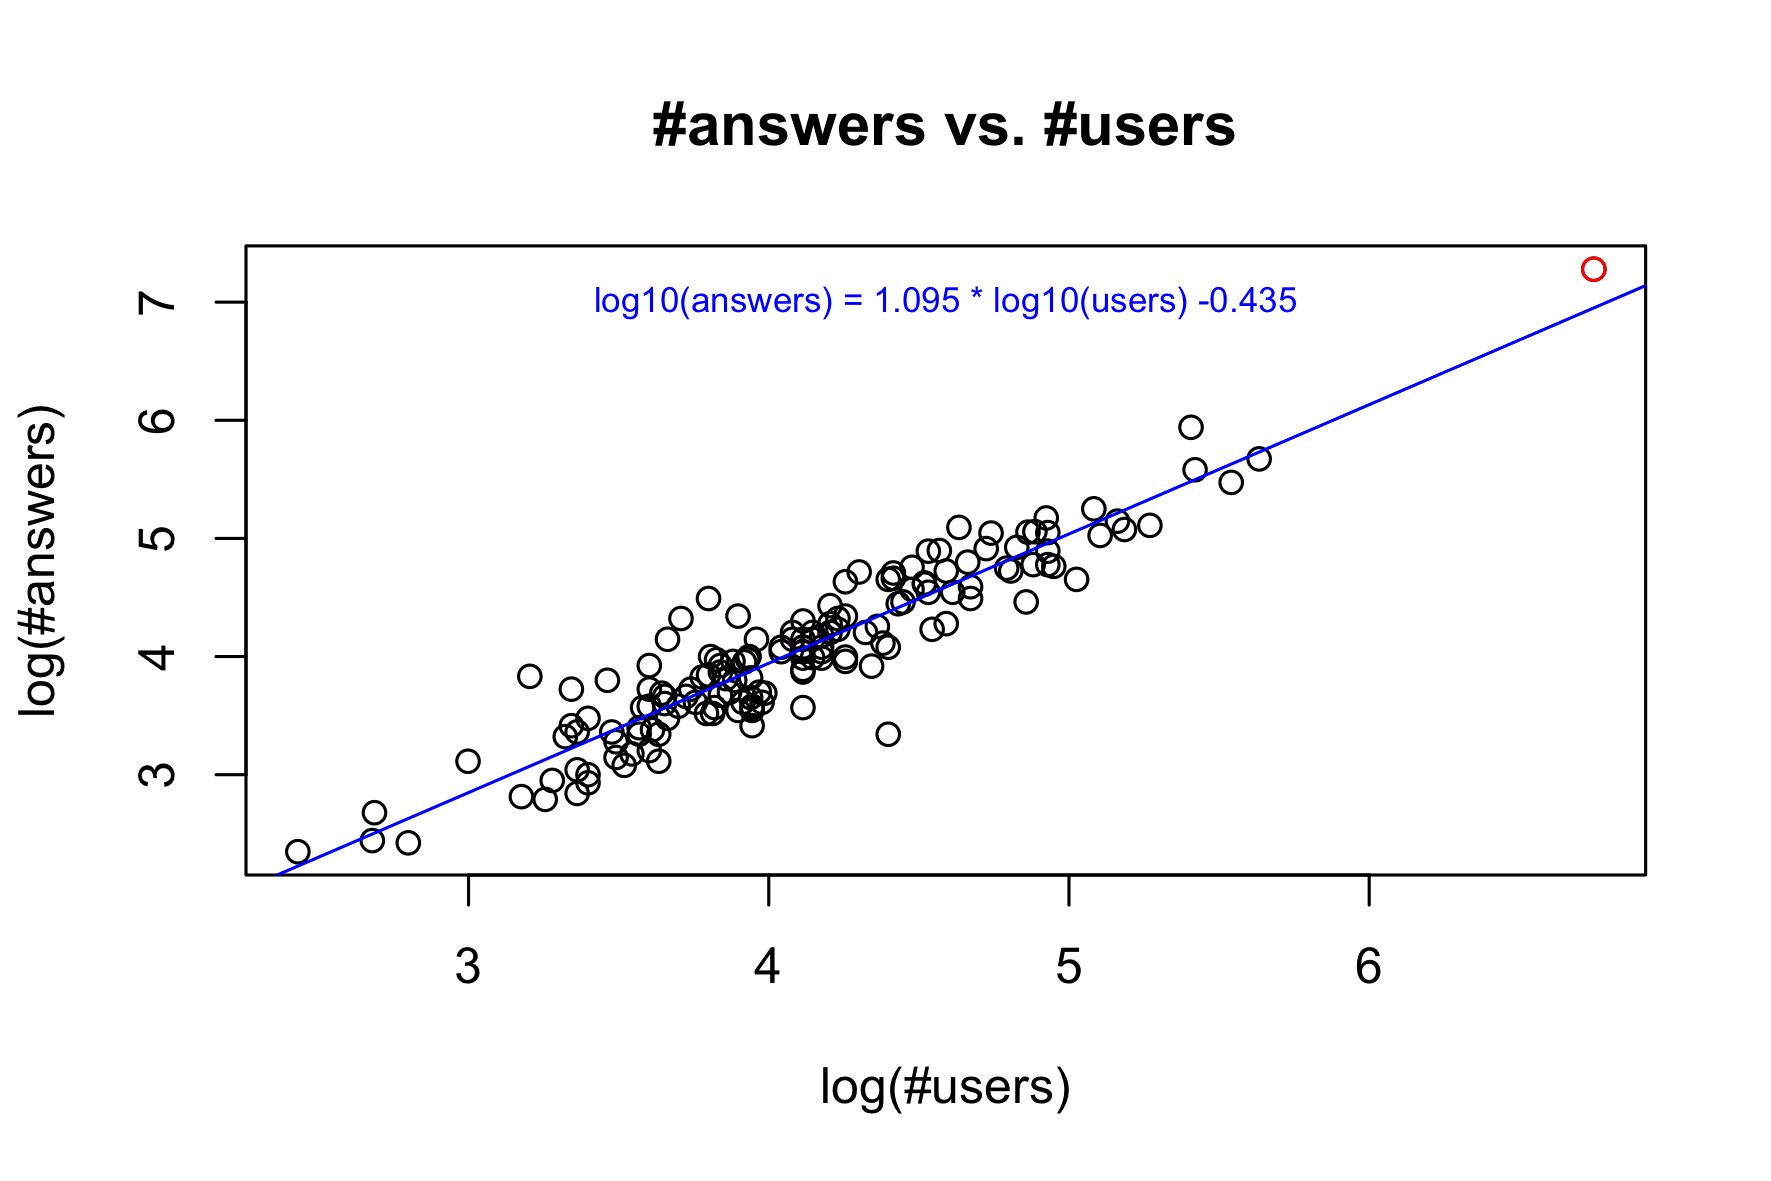
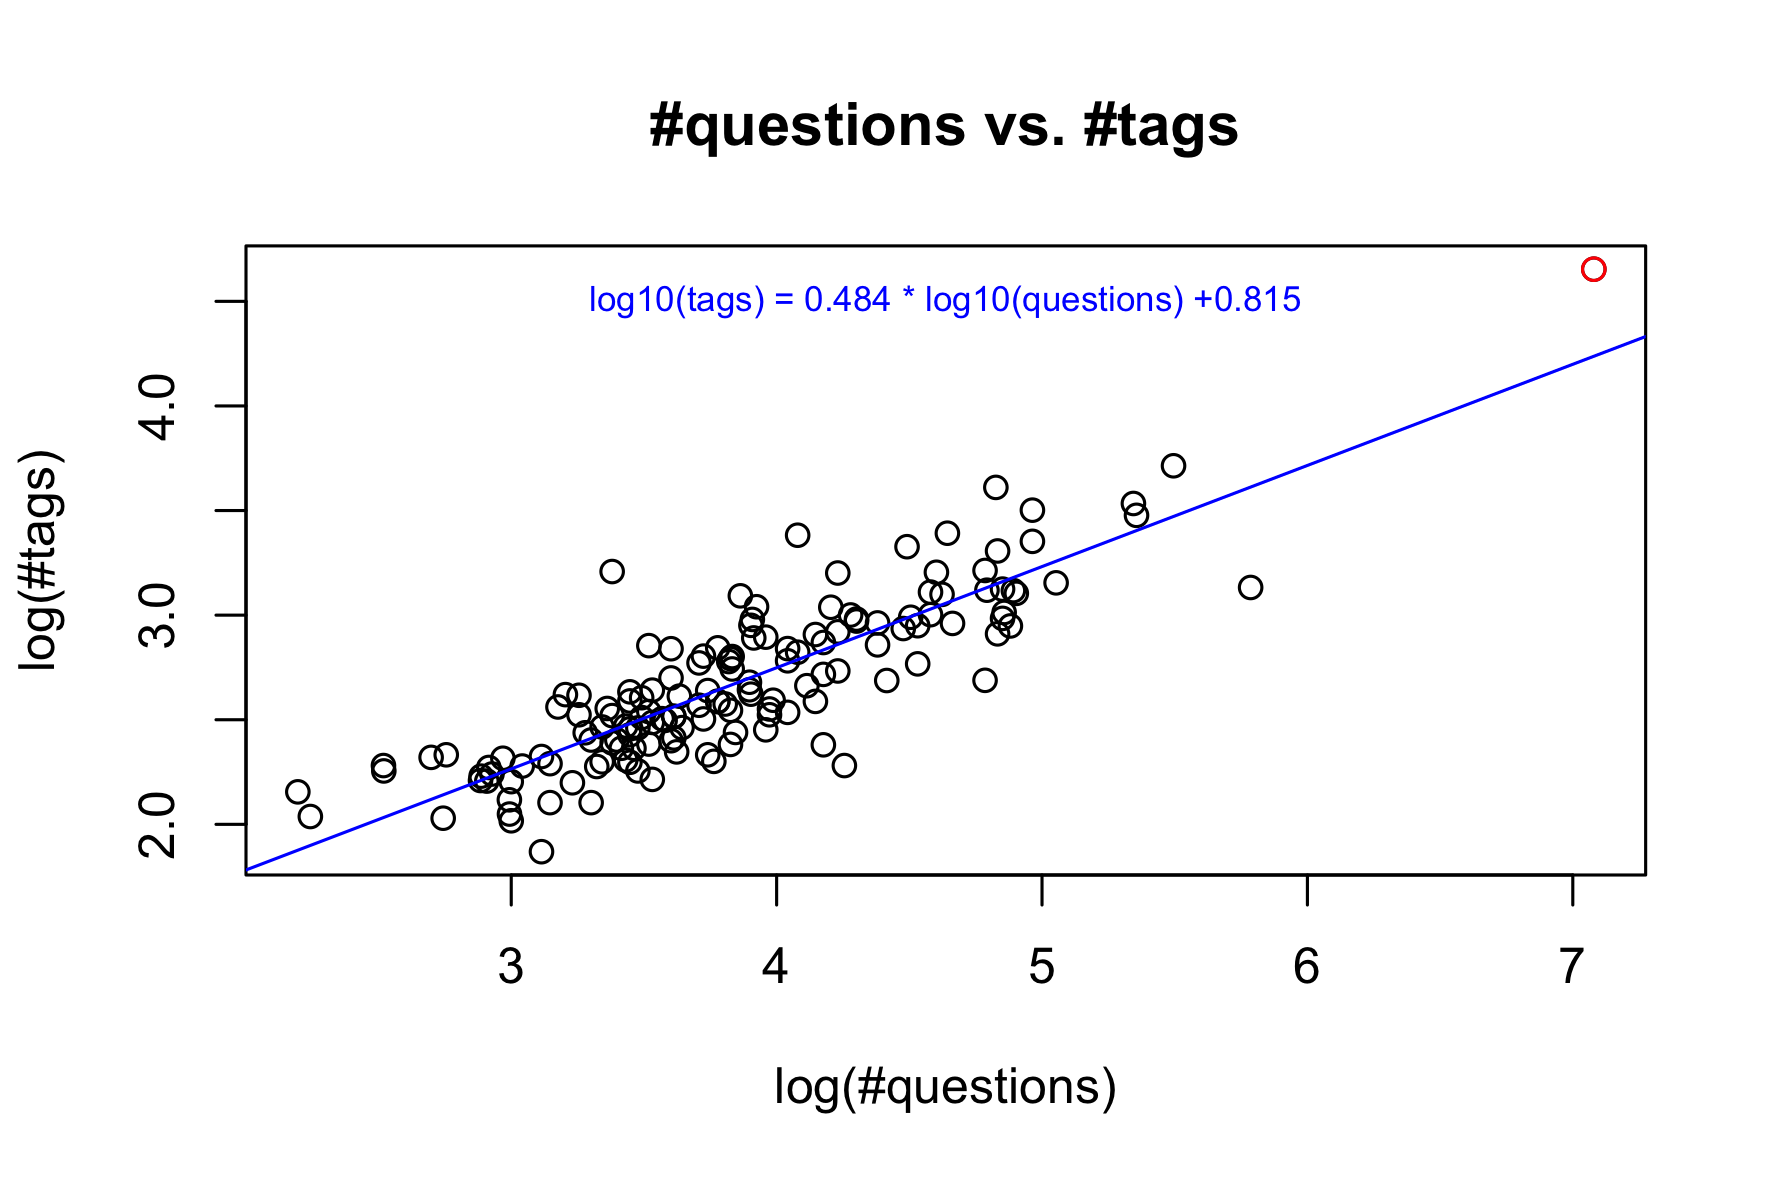
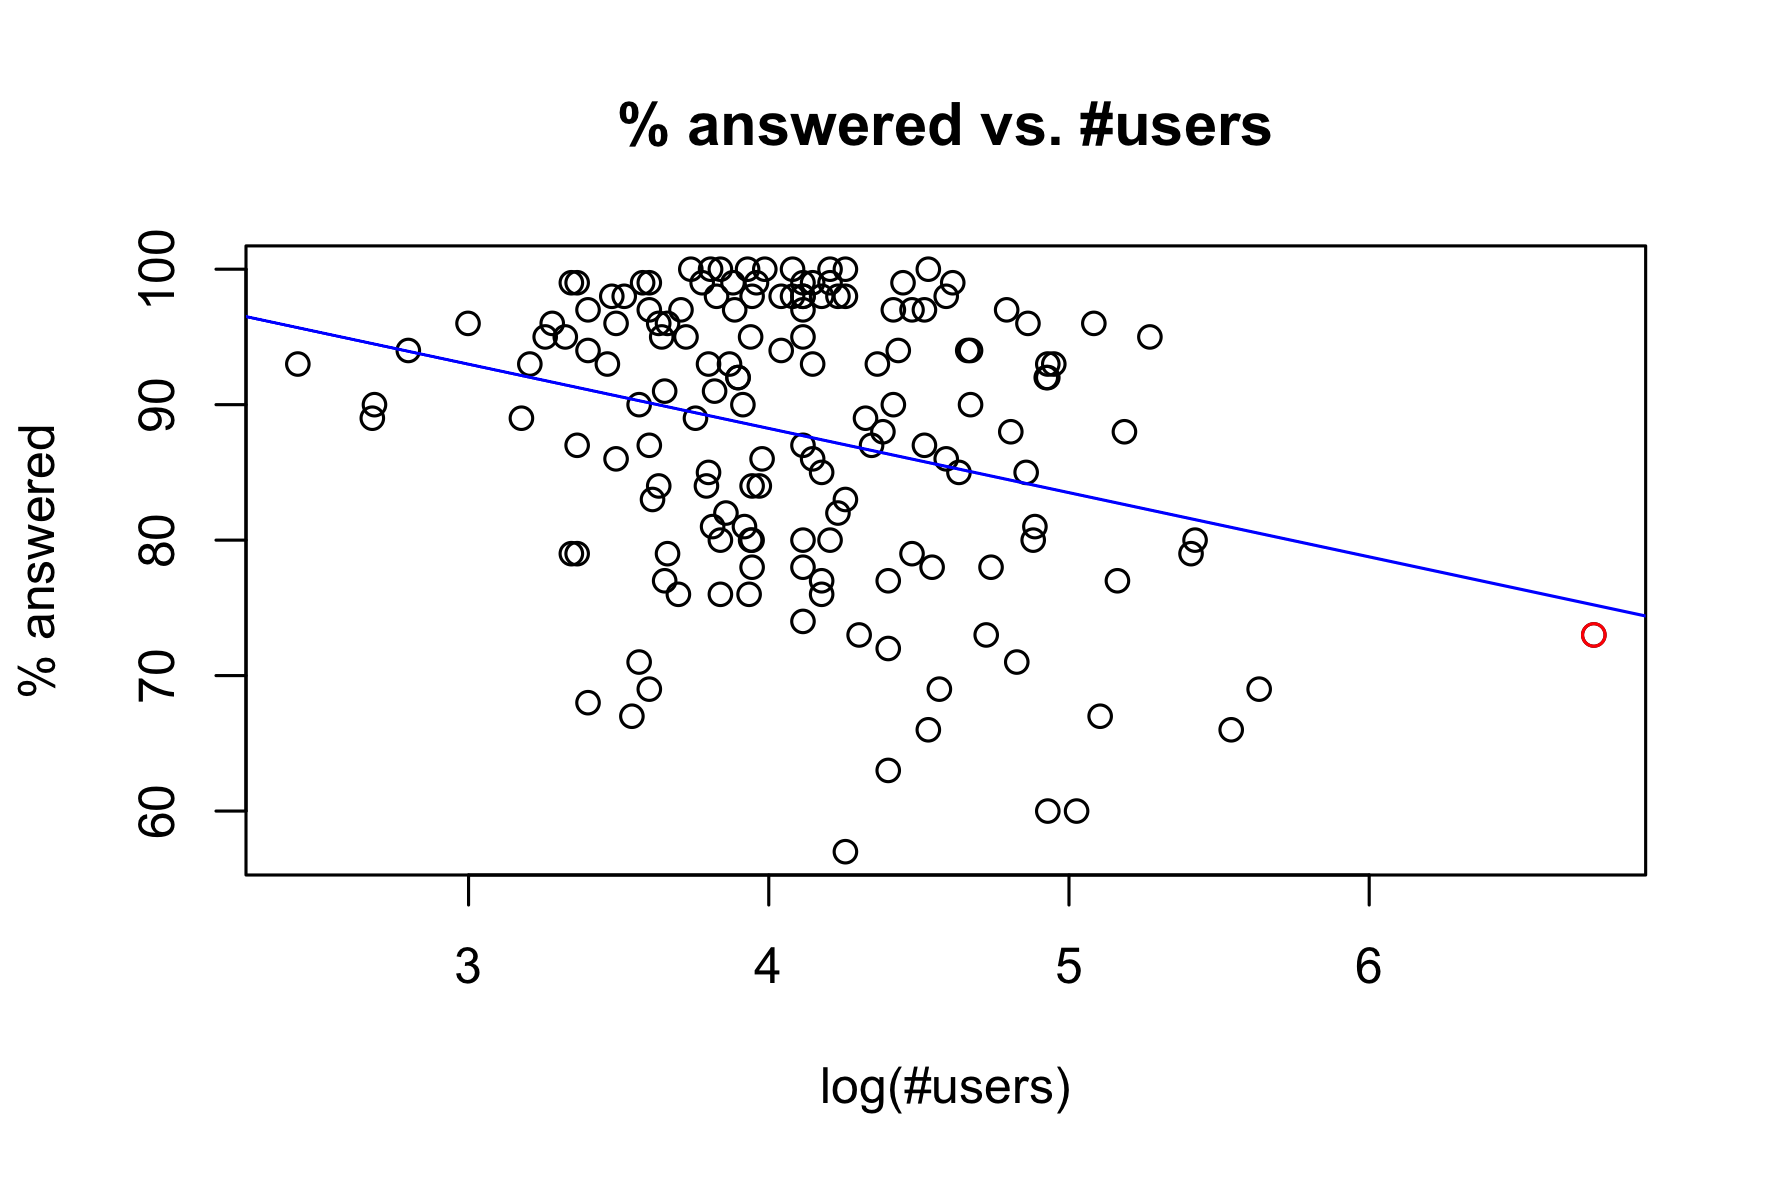
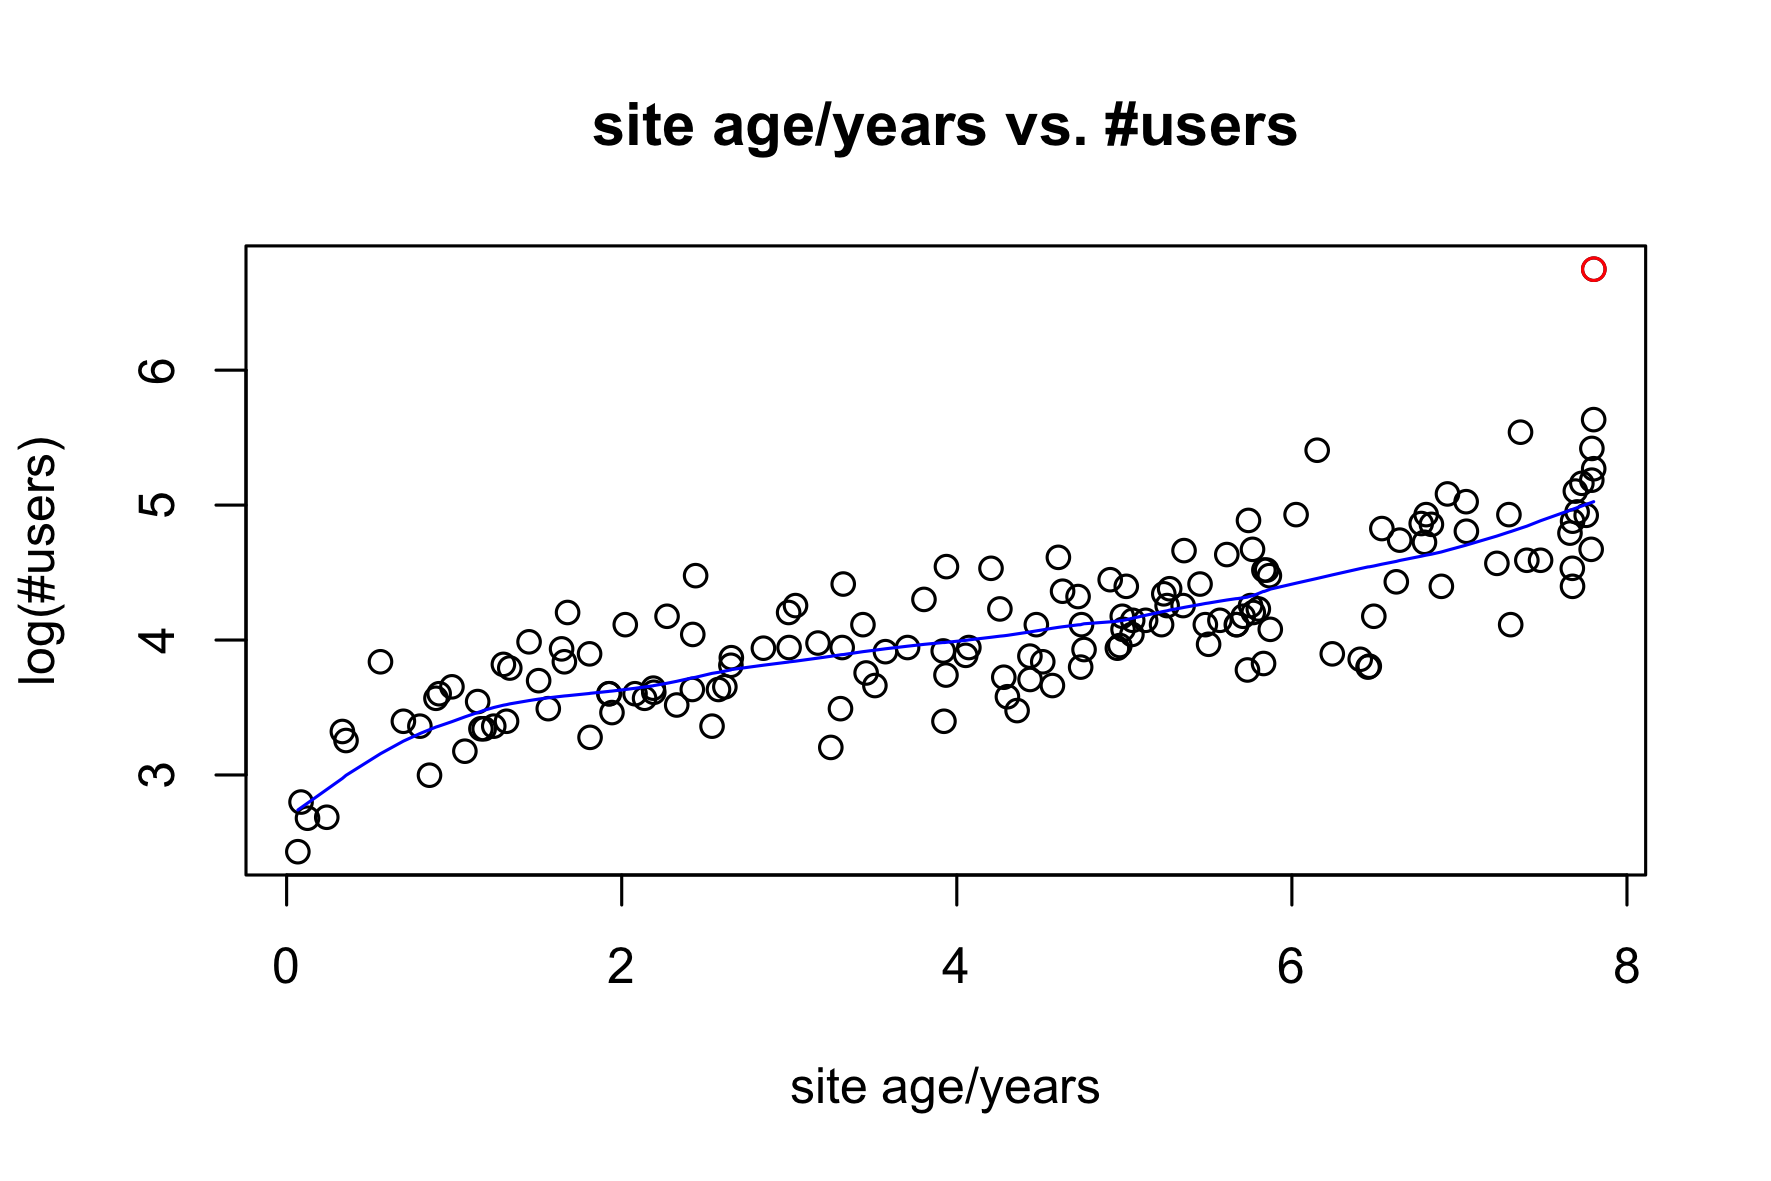
Since stackoveflow site is so dominant it is identified as a red point in all the scatterplots.
The relationship between the number of users and the number of answers for each site is slightly more complicated. The slope coefficient is significantly different from 1 (the standard error is 0.03391). Doubling the number of users means having about 2.2 times more answers.
The linearity of #answers vs. #questions implies that the number of questions has a similar relation to the number of users. This seems to imply that a level of activity can only be maintained by the influx of new users.As can be expected, a site with more questions asked also has more tags.
The percentage of questions answered varies hugely, and there is a weak negative correlation between the percentage of questions marked as answered and the number of users.
Site age is the time (in years) since the first posted question.
Note that the stackoverflow site is not included in the regression.Note: New Stackexchange sites go through three phases before they are accepted. (See http://area51.stackexchange.com.)
- During the "definition" phase hypothetical questions are proposed and votes are cast whether or not they are good questions for the site.
- In the "commitment" phase a petition for the site's creation is presented and interested users are asked to digitally sign the proposal.
- In the "beta" phase the site goes live on a probationary basis to see if people use it. If the site does not get used, it will be deleted.
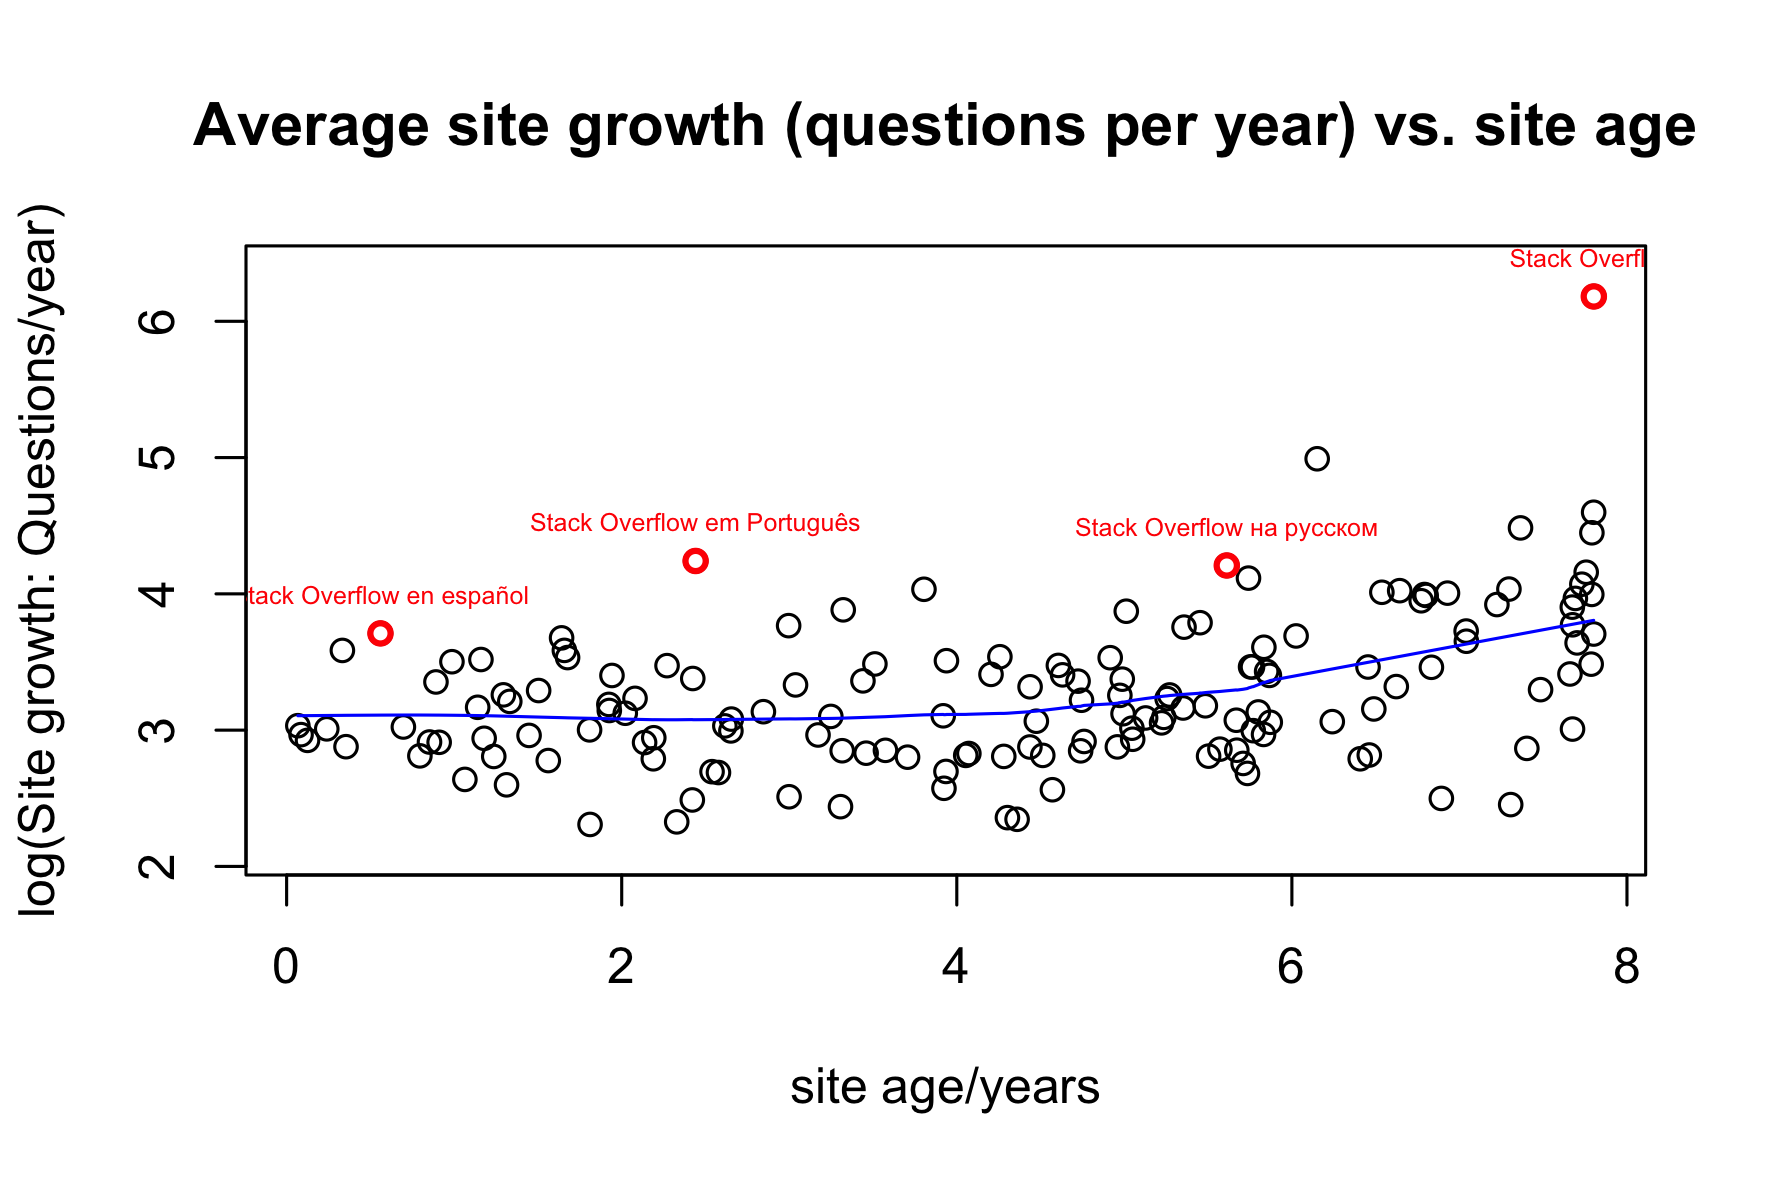
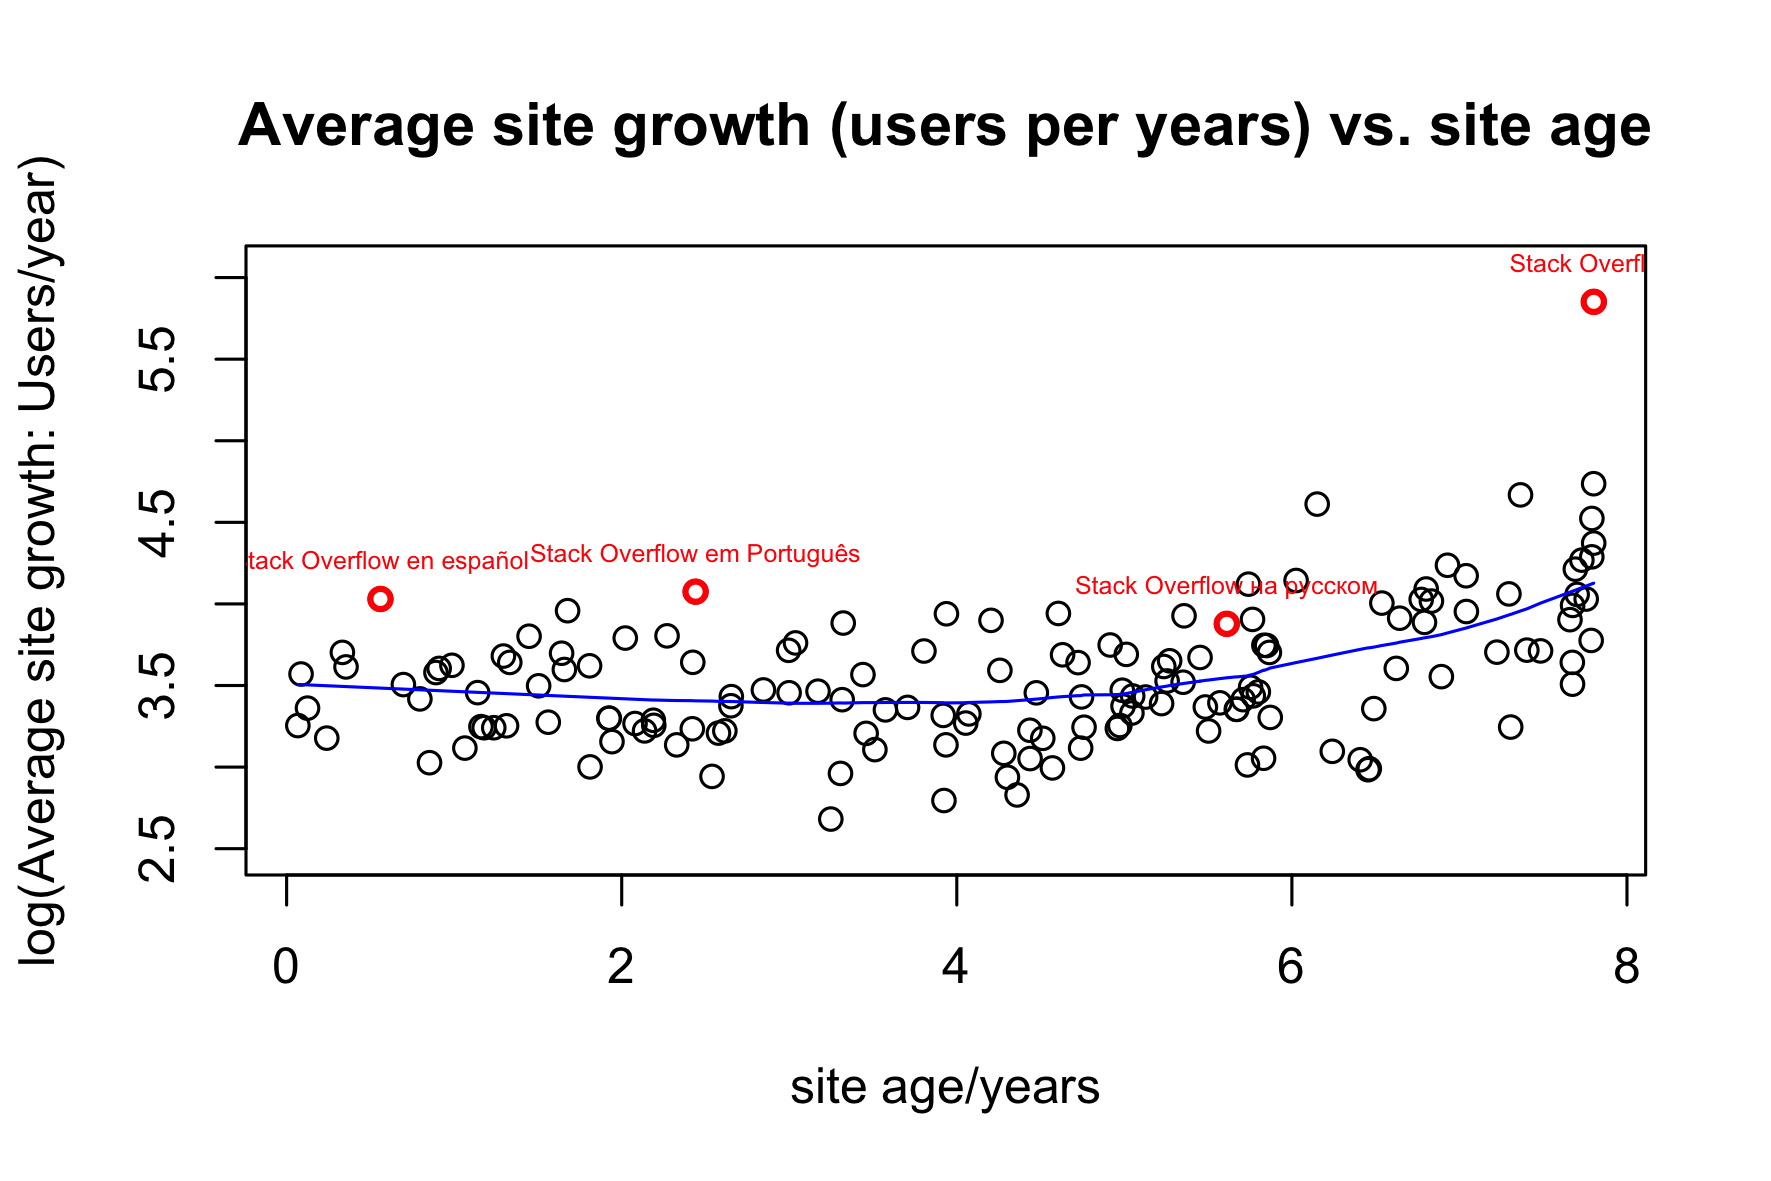
This means that a site goes into beta already many questions pre-defined, and therefore disproportianately many questions are asked shortly after going into beta. In order to account for this (in a very crude manner) the growth rate is defined as
growth rate = log10(#questions / (age+1/12)),i.e. the age is set to be effectilvely one month more than nominally.
It is interesing to plot the same graph with the number of users as a measure of site growth. The older sites had a higher average user growth rate than the younger sites.
This script downloads http://stackexchange.com/sites, parses it and extracts the statistics for each stackexchange site.
The result is written to the file stackexchange.csv in tab delimited format, and the result is also written to stackexchange.xlsx for consumption
in MS Excel.
The download is throttled and takes about 10 min for 150 sites.
Load and format the output of get-sites.py and save the R data.frame with name
sites in the file in sites.RData.
The data.frame prepared by load.R is loaded and a couple of graphs
are generated.
Type make analysis or make to run everything. Note that the download
of all the data is throttled and takes about 10 min.
The graphs generated by analyse-sites.R are saved here.
To run the scripts you need python (v2) and R. The required python modules and R packages are:
- BeautifulSoup4 for parsing web pages.
- Selenium for downloading web pages from stackexchange.
- xlsxwriter for saving Excel files.
- R.utils for the sprintf function.
In the Terms of Service (TOS) Stackexchange distinguishes between Network Content and Subscriber Content. What exactly constitutes network content is not really clear (to me). Presumably, network content is whatever is not subscriber content.
The subscriber content has a Creative Commons license:
... [A]ll Subscriber Content ... is perpetually and irrevocably licensed to Stack Exchange under the Creative Commons Attribution Share Alike license.
This means the content can be changed and adapted to any purpose by Stackexchange, and anyone else, as long as appropriate credit is given and changes are identifiable. In fact, the TOS reiterate these rights:
Subscriber may download or copy the Content, and other items displayed on the Network for download, for personal use, provided that Subscriber maintains all copyright and other notices contained in such Content.
This is interesting to know, but it does not have any implications, here.
For the legality of the present work the rules for network content are important:
Subscriber may download or copy the Content, and other items displayed on the Network for download, for personal use, provided that Subscriber maintains all copyright and other notices contained in such Content.
Finally, the TOS prohibit
[a]ny fraudulent, abusive, or otherwise illegal activity ...
My interpretation, in a nutshell, is this: Information can be downloaded in a non-abusive way for personal use. BUT, since I'm not a lawyer all I can do is to advise you: Read the TOS yourself and make your own judgement!
Copyright © 2016 Markus Mayer.
The programs are free software; you can redistribute them and/or modify them under the terms of the GNU General Public License as published by the Free Software Foundation; either version 3 of the License, or (at your option) any later version.
The programs are distributed in the hope that they will be useful, but WITHOUT ANY WARRANTY; without even the implied warranty of MERCHANTABILITY or FITNESS FOR A PARTICULAR PURPOSE. See the GNU General Public License for more details.
You should have received a copy of the GNU General Public License along with this program; if not, see http://www.gnu.org/licenses.
