An R package to (possibly) resurrect (some of) the CAFE (Cellular Analysis of Fire and Extinction) simulation model that was used for a series of studies by Ross Bradstock and colleagues in the 1990s, investigating plant population dynamics in relation to various wildfire regimes.
You can install the development version of RCAFE from GitHub with:
# install.packages("devtools")
devtools::install_github("mbedward/RCAFE")
To install on a Windows system you will need to have Rtools installed to build the C++ functions in the package.
library(RCAFE)
library(terra)
#> terra 1.7.78library(progress)
# Create a matrix of random time since fire values (implicitly treated as years).
# The matrix dimensions will also define the simulation landscape.
sidelen <- 200
MinTSF <- 0
MaxTSF <- 10
tsf <- matrix(as.integer(sample(MinTSF:MaxTSF, size = sidelen*sidelen, replace = TRUE)),
sidelen, sidelen)
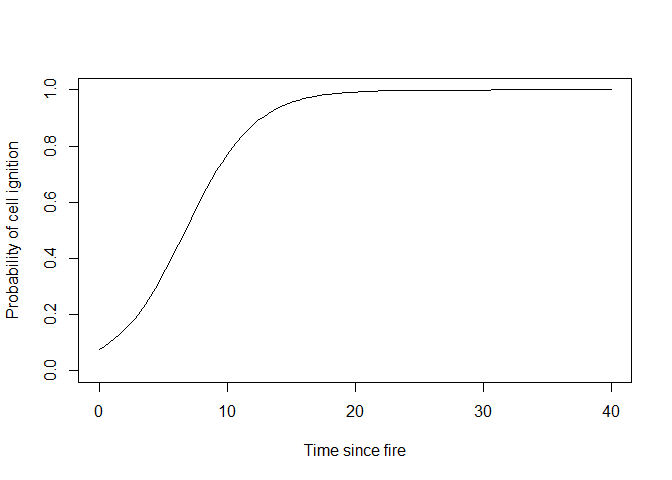
plot(rast(tsf))# A function to relate the probability of fire in a cell to the
# time since fire
fn_prob <- function(tsf) {
1 / (1 + exp(2.5 - 0.37*tsf))
}
curve(fn_prob(x), from = 0, to = 40, ylim = c(0, 1),
xlab = "Time since fire", ylab = "Probability of cell ignition")# Simulate fires for an intial period to evolve spatial structure in the
# pattern of time since fire
Nburn_in <- 400
pb <- progress_bar$new(total = Nburn_in)
for (i in 1:Nburn_in) {
pb$tick()
res <- RCAFE:::doFire(tsf, fn_prob)
# Update the TSF matrix based on the fire map returned by
# the doFire function
tsf <- tsf + 1
tsf[res$landscape > 0] <- 0 # Burnt cells
}
#> 100%[=======================================================================]
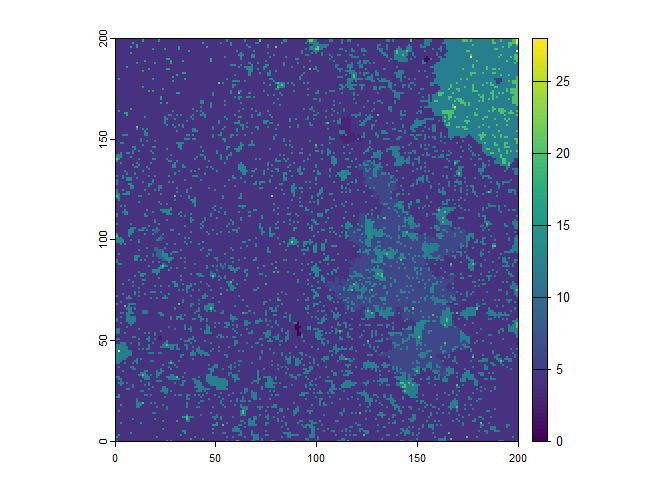
#> 100%# View the resulting TSF pattern
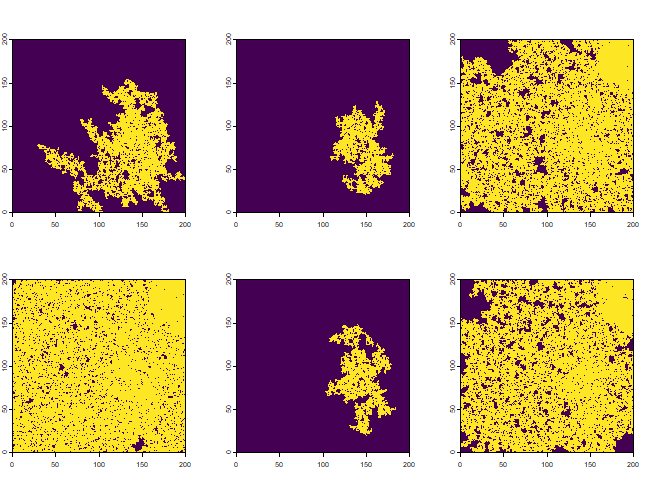
plot(rast(tsf))# Simulate a few more fires and plot them to get some idea of
# the general patterns. We will only plot fires that burnt at least
# 5% of the landscape.
min_landscape_prop <- 0.05
Nfires <- 6
rr <- lapply(1:Nfires, function(...) {
tsfx <- tsf
while (TRUE) {
res <- RCAFE:::doFire(tsf = tsfx, fn_prob)
tsfx <- tsfx + 1
tsfx[res$landscape > 0] <- 0
if (res$ncells > sidelen*sidelen*min_landscape_prop) break
}
rast(res$landscape)
})
rr <- rast(rr)
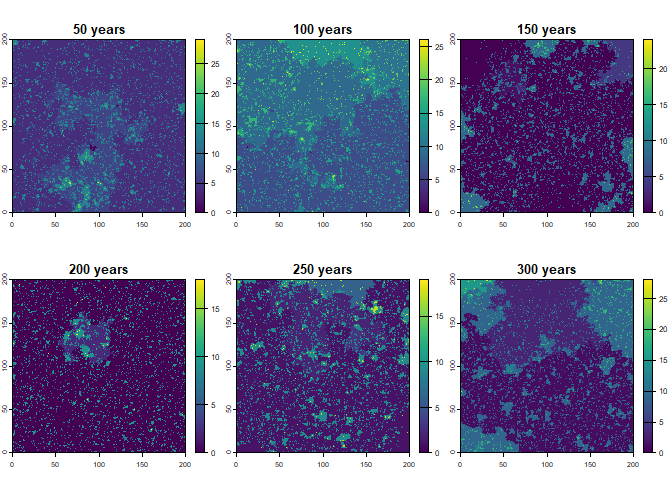
plot(rr, legend = FALSE, main = "")# Run the simulation function for a set of 50 year batches and view the
# time since fire pattern at the end of each batch
#
Nbatches <- 6
Nyears <- 50
rr <- lapply(1:Nbatches, function(i) {
tsf <<- RCAFE:::cafeSim(initial_tsf = tsf, n_times = Nyears, fn_prob_tsf = fn_prob)
rast(tsf)
})
rr <- rast(rr)
names(rr) <- sprintf("%d years", seq_len(Nbatches) * Nyears)
plot(rr)


