SELECT *
FROM information_schema.__internal_partitions__
WHERE table_schema = '<DATABASE_NAME>'
        AND table_name = '<TABLE_NAME>'
ORDER BY partition_valueAmazon Athena is a serverless Presto environment that you may use to run SQL queries directly on objects in Amazon S3.
You can use Athena to quickly query and explore your AWS costs, but you must first enable AWS Cost and Usage Reports to export to Amazon S3.
To enable these reports, navigate to AWS Cost and Usage Reports Console and click Create report.
To learn more about these reports, visit the link below: https://docs.aws.amazon.com/awsaccountbilling/latest/aboutv2/billing-reports-costusage-files.html
By enabling a cost report and choosing the option to Enable report data integration for Amazon Athena, AWS will output cost reports to the S3 bucket of your choice and also create an AWS Glue crawler to periodically crawl the bucket and catalog new reports to a cost table maintained in the Glue catalog. Once the data is catalogued, you can easily query the data using queries like those shown below.
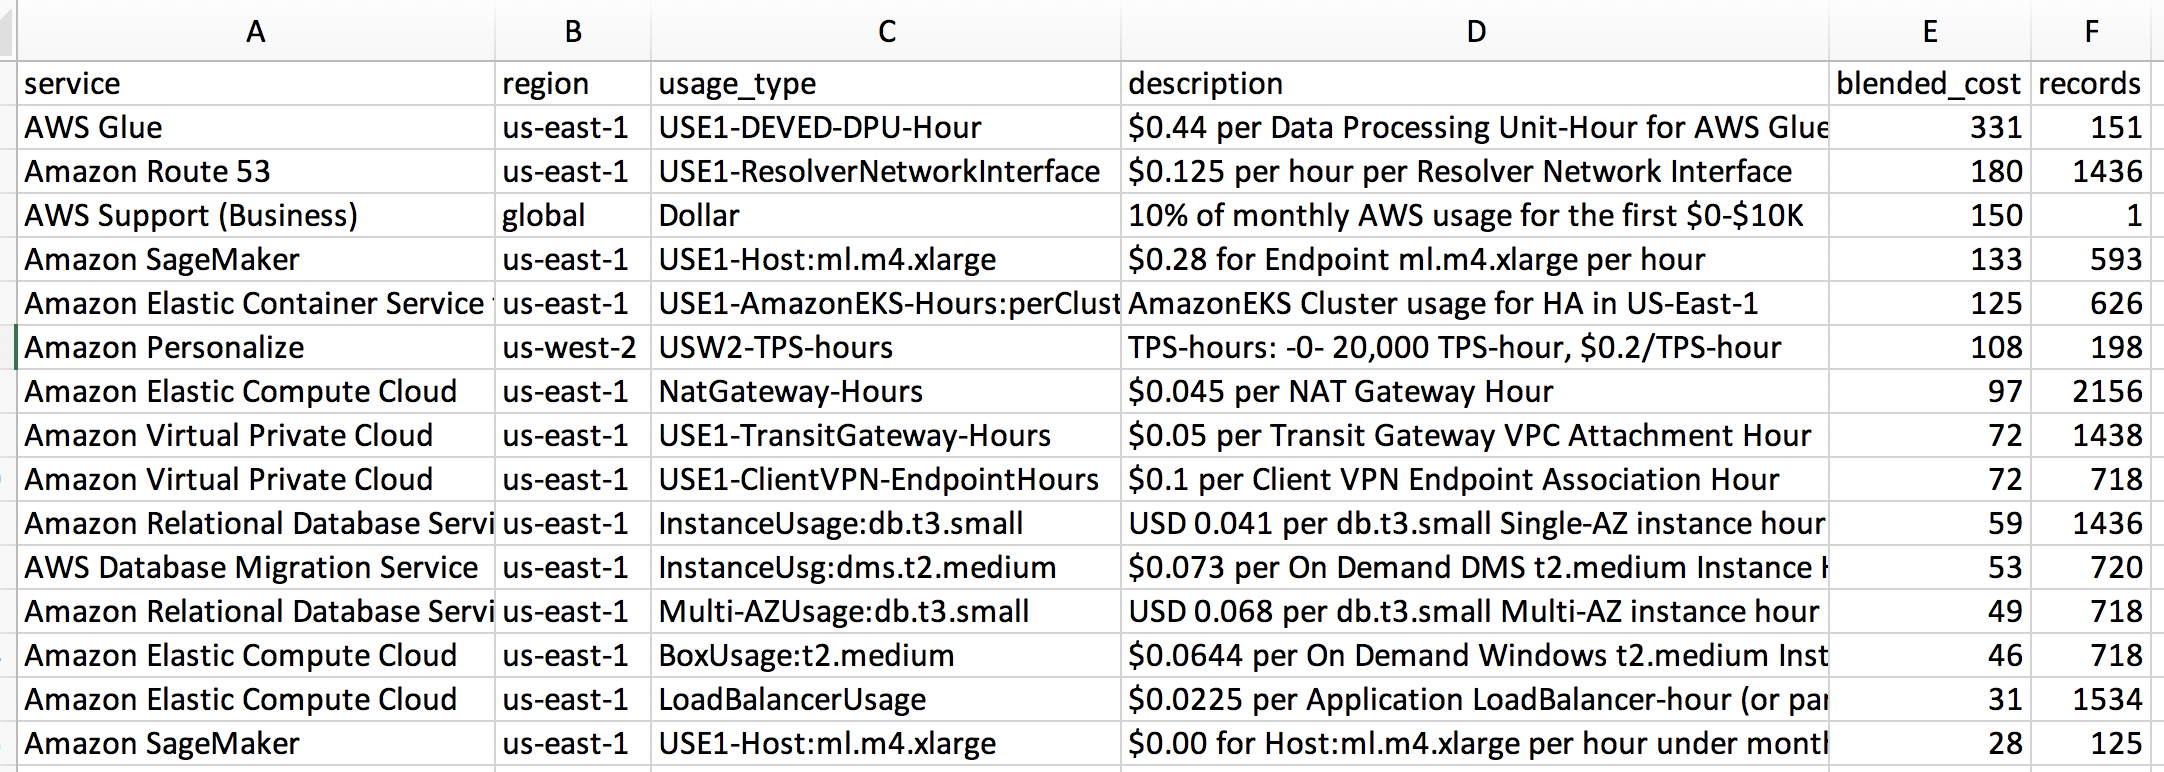
SELECT product_region                       AS region,
       product_product_name                 AS service,
       line_item_usage_type                 AS usage_type,
       line_item_line_item_description      AS description,
       round(sum(line_item_blended_cost),0) AS blended_cost,
       count(*)                             AS records
FROM     hourly_cost_for_athena
WHERE    line_item_usage_start_date >= (CURRENT_DATE - interval '30' day)
GROUP BY product_region,
         product_product_name,
         line_item_usage_type,
         line_item_line_item_description
HAVING   round(sum(line_item_blended_cost),0) <> 0
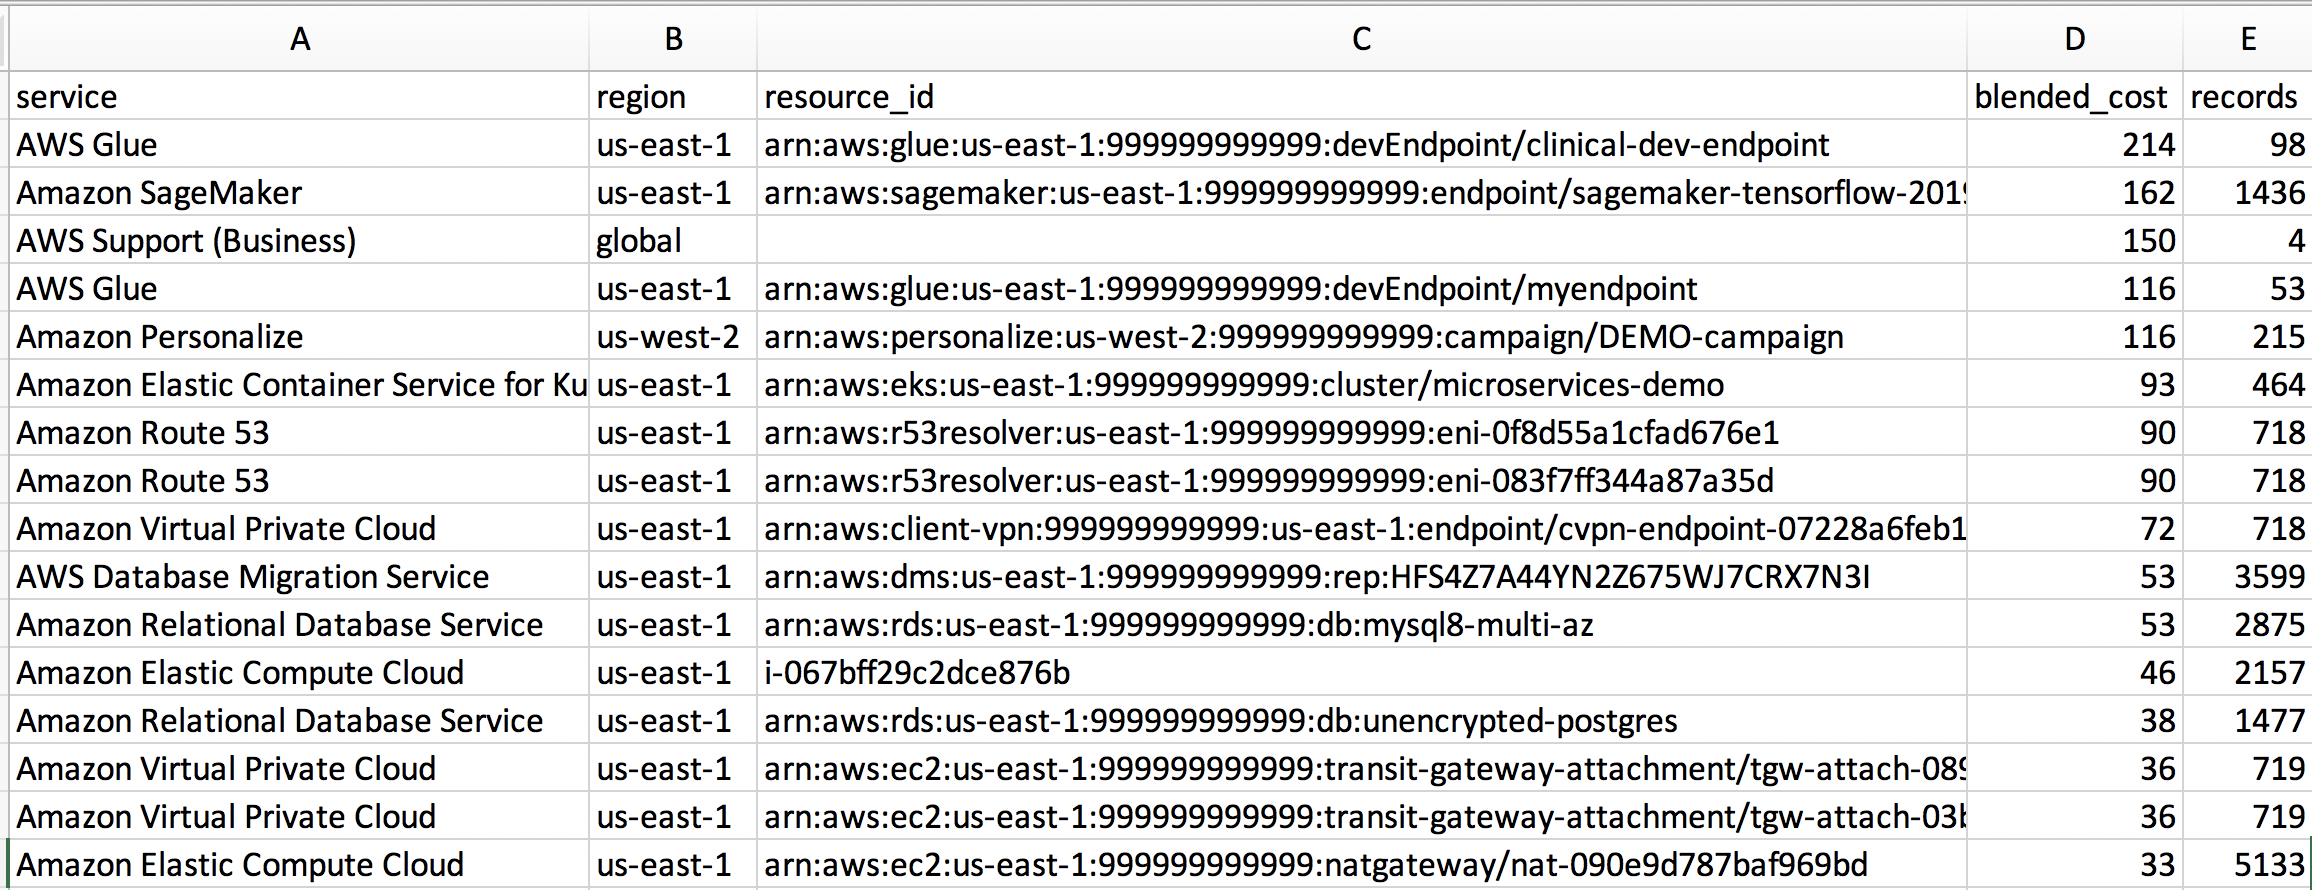
ORDER BY blended_cost DESC; Want to know how much a specific resource ID (e.g. EC2 instance, EBS volume, load balancer, etc.) is costing you? You can use this report if you have enabled resource IDs in your cost report. Note that enabling resource IDs may significantly increase the storage size of your cost reports in S3:
SELECT CAST(min(line_item_usage_start_date) AS date)    AS start_date,
       CAST(max(line_item_usage_start_date) AS date)    AS end_date,
       product_product_name                 AS service,
       product_region                       AS region,
       line_item_resource_id                AS resource_id,
       round(sum(line_item_blended_cost),0) AS blended_cost,
       count(*)                             AS records
FROM     hourly_cost_for_athena
WHERE    line_item_usage_start_date >= (CURRENT_DATE - interval '30' day)
GROUP BY product_product_name,
         product_region,
         line_item_resource_id
HAVING   round(sum(line_item_blended_cost),0) <> 0
ORDER BY blended_cost DESC;In the query below, note that:
-
Costs are summarized according to region, service, and day
-
interval '10'in the first CTE controls how many days we're looking back. -
Because the source data from the Cost Report might be not have data for a particular region/service/day combination, the
prior_costin the SQL below does not mean the prior day's cost. It instead means the prior cost of the most recent day for a particular region/service/day.For example, imagine that we used EC2 on Jan 1st and 2nd and Jan 10th for $10, $8, and $6, respectively. The results you see would be:
day         service       cost       previous_cost
1/1/2019     EC2           $10        <null>
1/2/2019     EC2           $8         $10
1/10/2019    EC2           $6         $8
If you want "prior cost" to literally be the prior day, even if that row does not exist (because it was zero), you'll have to "backfill" the detail CTE for missing rows. Filling in Data Potholes with Recursive CTEs (by Kendra Little) explains possible ways to do this.
with detail AS (
  SELECT
    product_region as region,
    product_product_name AS aws_service,
    CAST(line_item_usage_start_date AS DATE) AS day,
    round(sum(line_item_blended_cost),2) AS day_cost
  FROM
    hourly_cost_for_athena
  WHERE
    line_item_usage_start_date >= (CURRENT_DATE - interval '20' day)
  GROUP BY
    product_region,
    product_product_name,
    CAST(line_item_usage_start_date AS DATE)

),
precomputed AS (
  SELECT
    region,
    aws_service,
    day,
    day_cost,
    lag(day_cost,1) OVER (PARTITION BY aws_service, region ORDER BY day ASC) AS prior_cost
  FROM
    detail
  GROUP BY
    region,
    aws_service,
    day,
    day_cost
)
SELECT
  region,
  aws_service,
  day,
  day_cost,
  prior_cost,
  round(day_cost - prior_cost, 2) AS change_from_prior
FROM
  precomputed
ORDER BY
  region,
  aws_service,
  day DESC
Note - this is only for standard EC2 instances. It doesn't include other services that use EC2 (e.g. ElastiCache, RDS, etc.):
SELECT year,
       month,
       product_region as "region",
       product_servicecode as "service",
       product_instance_type as "instance_type",
       product_operating_system as "OS",
       product_tenancy as "tenancy",
       sum(line_item_usage_amount) as "hours"
FROM     hourly_cost_for_athena
WHERE    year = '2020' and month in ('1','2','3')
         and line_item_blended_cost <> 0
         and pricing_unit = 'Hrs'
         and product_product_family = 'Compute Instance'
         and product_servicecode = 'AmazonEC2'
GROUP BY
year,
month,
product_region,
product_instance_type,
product_operating_system,
product_tenancy,
product_servicecode
ORDER BY
   year desc,
   month desc,
   region,
   instance_type
SELECT year,
       month,
       bill_invoice_id,
       line_item_usage_account_id,
       product_region,
       line_item_resource_id,
       line_item_usage_type,
       product_group,
       line_item_product_code,
       line_item_line_item_description,
       Sum(line_item_usage_amount)   AS usage_amount,
       pricing_public_on_demand_rate AS price_per_unit,
       round(Sum(line_item_blended_cost),2)   AS total_cost
FROM   hourly_cost_for_athena
WHERE  year = '2019'
       AND line_item_product_code = 'AWSLambda'
GROUP  BY year,
          month,
          bill_invoice_id,
          line_item_usage_account_id,
          product_region,
          line_item_resource_id,
          line_item_usage_type,
          product_group,
          line_item_product_code,
          line_item_line_item_description,
          pricing_public_on_demand_rate
Query below shows any items where the price per unit is zero.
Alternatively, you might try lower(line_item_line_item_description) LIKE '%free%', not sure if one is better over the other or how consistently the word "free" appears in free-tier line items.
SELECT
  line_item_product_code AS product ,
  line_item_operation AS operation ,
  line_item_usage_account_id AS account ,
  line_item_line_item_description AS billing_description,
  pricing_unit ,
  round(SUM(line_item_usage_amount),3) AS usage_quantity

FROM hourly_cost_athena

WHERE
  line_item_unblended_rate = '0.0000000000'
  AND line_item_usage_start_date >= (CURRENT_DATE - interval '30' day)

GROUP BY
  line_item_usage_account_id ,
  line_item_product_code ,
  line_item_operation ,
  pricing_unit ,
  line_item_line_item_description

HAVING SUM(line_item_usage_amount) > 0

ORDER BY product, operation

