by: David Hughes and Laura Corbin date: June 3rd 2019

- Reads in and processes (un)targeted metabolite data, saving datasets in tab-delimited format for use elsewhere
- Provides useful summary data in the form of tab-delimited text file and a html report.
- Performs data filtering on the data set using a standard pipeline and according to user-defined thresholds.
Dec 22, 2022
- Nightingale Health has updated their data release format and has changed the spelling/format of some metabolite names. We have updated our annotation file for automatic annotation of Nightingale Health data, but you will - at present - need to extract the metabolite and sample data from your Nightingale Health release and run them as flat text files.
- Nightingale Health: IF there is a metabolite ID that metaboprep can not automatically annotate, because the spelling has changed it would be best to identify this change and edit the spelling manually before running metaboprep.
- Nightingale Health: IF there is a metabolite ID that metaboprep can not automatically annotate, because it is a new feature, then you can still run metaboprep BUT if that feature is a derived feature - like a ratio - and you want to exclude ratios from some of the QC steps such as when identifying independent features or estimating PCs, then metaboprep will - at present - not be able to exclude this feature. We are aware of this issue and are looking for a fix.
- Metabolon has a new data release format. We are working to incorporate it into the package. At present you will just have to extract the metabolite, sample annotation, and feature annotation files as flat text files, and run them as such.
-
To install do the following
-
quick install
-
start an R session
-
install the metaboprep package with
devtools::install_github("MRCIEU/metaboprep")
-
from this repo download a copy of the following files
- run_metaboprep_pipeline.R
- parameter_file.txt
-
You can also download or clone the entire repo with
git clone https://github.com/MRCIEU/metaboprep.git
-
-
alternatively you can download the package manually
-
download a copy of the depository
-
unzip/pack the download
-
place the directory somewhere sensible
-
start an R session
-
set your working directory to the parent directory of the repo
-
install R package with:
devtools::install("metaboprep")
-
-
A common installation error is produced by installation errors of dependent packages. If you experience this, install those dependent packages manually with BiocManager, and then attempt the installation of metaboprep again. You might have to repeat this step more than once.
if (!requireNamespace("BiocManager", quietly = TRUE))
install.packages("BiocManager")
BiocManager::install("MISSINGPACKAGENAME")
-
-
Edit the paramater (parameter_file.txt) file
- do not add any spaces before or after the "=" sign in the paramater file.
- the paramater file can be located anywhere
-
Move to the, or a, directory containing a copy of:
- run_metaboprep_pipeline.R
-
Make sure that R is in your environment - an often necessary step if working on an HPC.
- for example: module add languages/R-3.5-ATLAS-gcc-7.1.0
-
Run the metaboprep pipeline on a terminal command line as follows:
Rscript run_metaboprep_pipeline.R /FULL/PATH/TO/example_data/excel/parameter_file.txt
-
If you experienced issues with the geneartion of the html report on an HPC, the report can be generated on a local machine as follows.
-
move to your newly generated metaboprep project directory.
- it will take the form of "../metaboprep_release_TODAYSDATE/"
-
You should find an R data object called "ReportData.Rdata". Save a copy locally.
-
Open an R session
-
produce report with the function metaboprep::generate_report() as
output_dir_path = paste0("FULL/PATH/TO/DIR/OF/CHOICE/")
rdfile = paste0(output_dir_path, "ReportData.Rdata")
generate_report( full_path_2_Rdatafile = rdfile, dir_4_report = output_dir_path )
-
An example data set can be found in the folder "example_data" here on the repository. It is a simulated data set of 100 metabolites, for 100 samples. There is a (1) metabolon like (v1 format) excel file of the data set, and a (2) flat text (tab delim) version of the data set. Both are accompanied by a parameter file to help guide you with the example. This example data includes data from two hypothetical mass spectrometry run modes or platforms, "neg" and "pos". As such, a subset of the metabolites were run (simulated) in the "neg" run mode in two batches, and the second subset of metabolites were run (simulated) in the "pos" run mode in three batches. Each batch was simulated with different mean abundance values to help illustrate possible batch effects and the normalization procedure. If looking at the flat text version of the example, information on which metabolites were simulated in which run mode or platform can be found in the flat text file "feature_data.txt" in the column "platform". Further, to identify which samples belonged to which batch, for each run mode, you would use the columns "neg" and "pos" in the flat text file "sample_data.txt".

See the Wiki page for a detailed synopsis of the pipeline here.
- Read in the paramater file
- Read in the data - (typically from a commercially provided excel file)
- metabolite abundance
- sample annotation
- feature annotation
- Write metabolite data, sample annotation and feature annotation to flat text file.
- Normalize data
- If data is from Metabolon or is any other technology that has run-mode or platform batches, median normalize the data.
- Estimate summary statistics on the raw data set (step B below)
- write summary stats to file
- Perfom the data filtering (step C below)
- using parameters passed in the parameter file
- write data filtering (metaboprep) data set to file
- Estimate sumary statistics on the filtered data set (step B below)
- write summary stats to file
- Generate html report
- Print scatter plot, histogram, and summary stats for every metabolite to a single PDF.
- Sample Summary Statistics
- sample missingness
- all features
- to the exclusion of xenobiotic and\or derived variables
- sample total sum abundance (TSA) (derived variables excluded)
- with all features
- with complete features only (no missingness)
- count of how many times a sample is an outlier across all feature
- each feature analyzed within its own sample distribution
- outliers determined as those +/- 5 IQR of the median.
- sample missingness
- Feature Summary Statistics
- feature missingness
- all samples
- to the exclusion of sample(s) with extreme missingness (>= 50%)
- distribution statistics
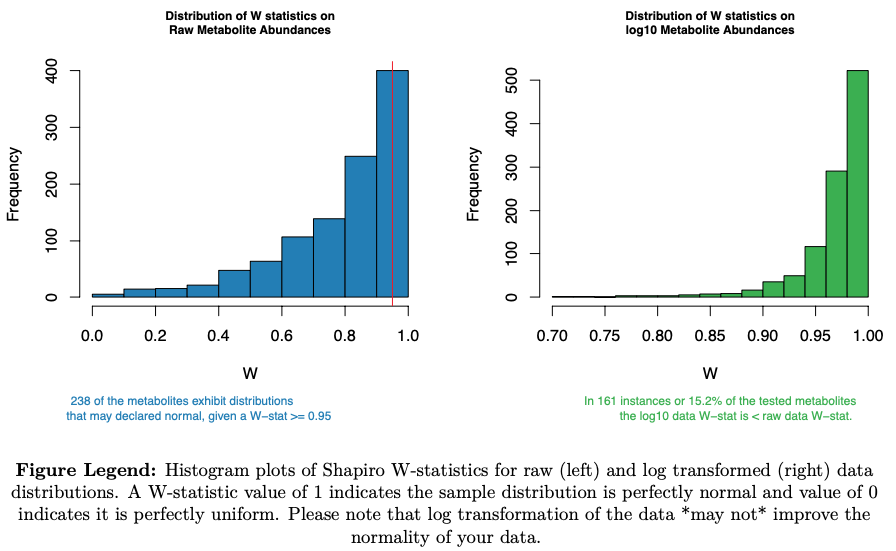
- shaprio's W-statistic of normality on raw distribution
- shaprio's W-statistic of normality on log10 distribution
- skewness
- kutosis
- N, sample size
- variance
- standard deviation
- coefficient of variation
- mean
- median
- min
- max
- feature outlying sample count
- count of outlying samples
- outliers determined as those +/- 5 IQR of the median.
- count of outlying samples
- feature missingness
- Feature and Sample structure
- feature:feature correlation structure (derived variables excluded)
- only includes features with at least 50 measurments
- or if the data set has an N<50 the missingness allowed is 0.8 * N
- estimate the number of independent features
- tag representitive features of feature clusters
- only includes features with at least 50 measurments
- sample:sample correaltion structure (derived variables excluded)
- principle components (PCA)
- derived from independent features
- missing data is imputed to the median estiamte of each feature
- identify PC outliers
- +/- 3,4,5 SD of mean for all significant PCs
- principle components (PCA)
- feature:feature correlation structure (derived variables excluded)
- If data is from Metabolon, exclude (but retain for step 11) xenobiotic metabolites from anlaysis.
- Estimate sample missingness and exclude extreme samples, those with a missingness >= 0.80 (or 80%) (derived variables excluded)
- Estimate feature missingness and exclude extreme features, those with a missingness >= 0.80 (or 80%)
- Re-estimate sample missingness and exclude samples >= user defined threshold (units: 0.2 or 20% missing) (derived variables excluded)
- Re-estimate feature missingness and exclude features >= user defined threshold (units: 0.2 or 20% missing)
- Estimate total sum abundance/area (the sum of all values) for each individual
- first z-transform each distribution
- second shift the mean of each distribution to the absolute minimum of ALL observed values
- TSA sample exclusion using a user defined threshold (units: +/- SD from mean) (derived variables excluded)
- To ignore this step set to NA in parameter file
- Identify outlier values for each feature using a user defined threshold (units: +/- IQR from median)
- User define what to do with outliers for the purposes of deriving the PCs only
- "leave_be" which means the outlier values will be left as they are.
- "turn_NA" which means they will be median imputed for the PCA.
- "winsorize" to the 100th quantile of all remaining (non-outlier values).
- Build feature:feature correlation matrix on filtered data derived from steps 1-6 above (derived variables excluded)
- To be included a feature must have a minimun of 50 observations, or N*0.8 observations if data set includes less than 50 individuals.
- Identify "independent" features using data from step 8 and user defined tree cut height.
- we retain the feature with the least missingness within a cluster, otherwise we select the first feature in the list.
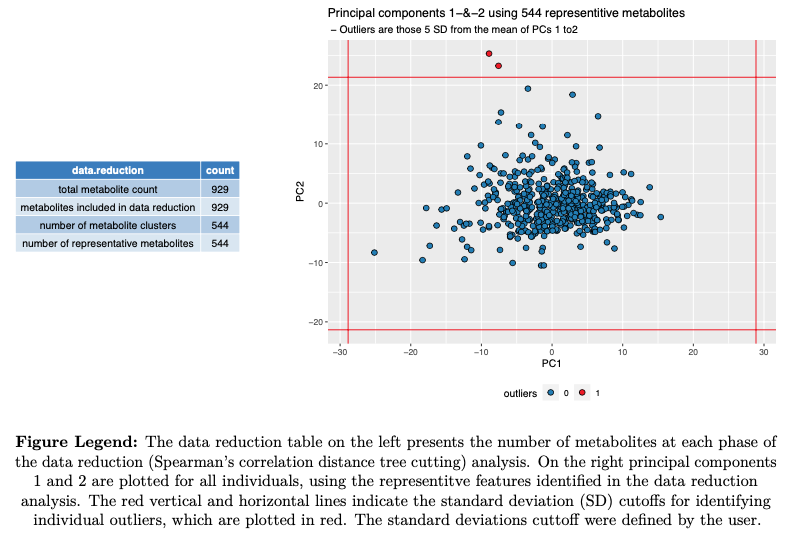
- Estimate principal components using independent features from step 9
- PC outlier samples exclusions using user defined threshold (units: +/- SD from the mean)
- If the data is from Metabolon we place the xenobiotic metabolites back into the filtered data set.
NOTE: Derived variable are those that are ratios or percentanges of two or more features already present in a data set, such as those found in Nightingale data.
---example figures provided for illustration---
- General information on study
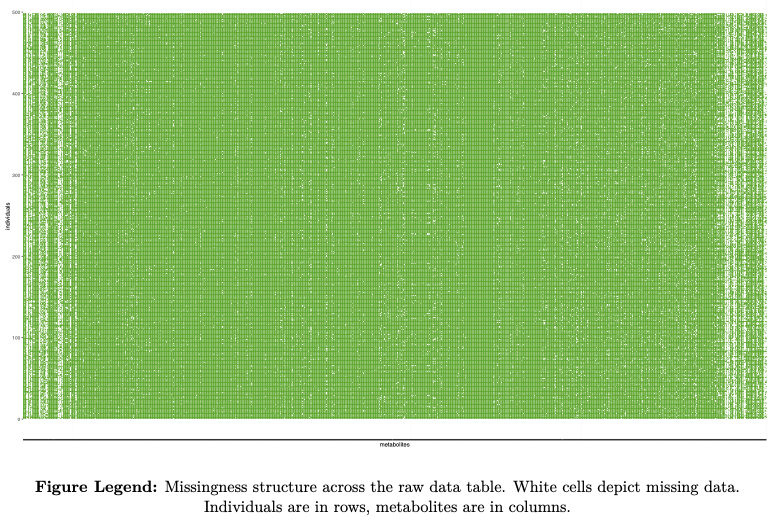
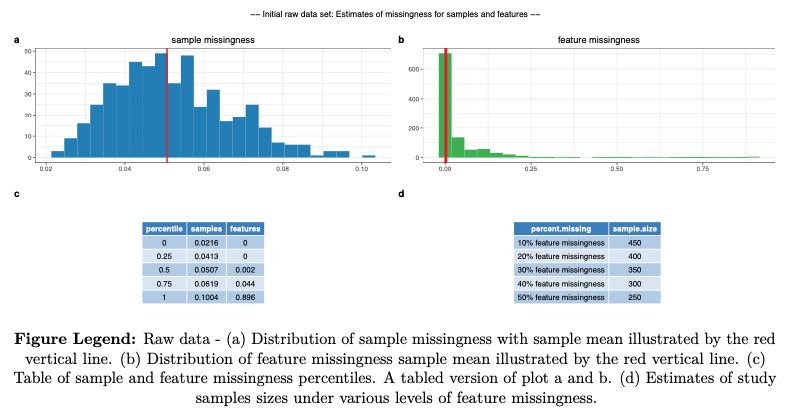
- Raw data summary
- sample size
- missingness
- table of data filtered exclusions
- figure of PCA oulier exclusions
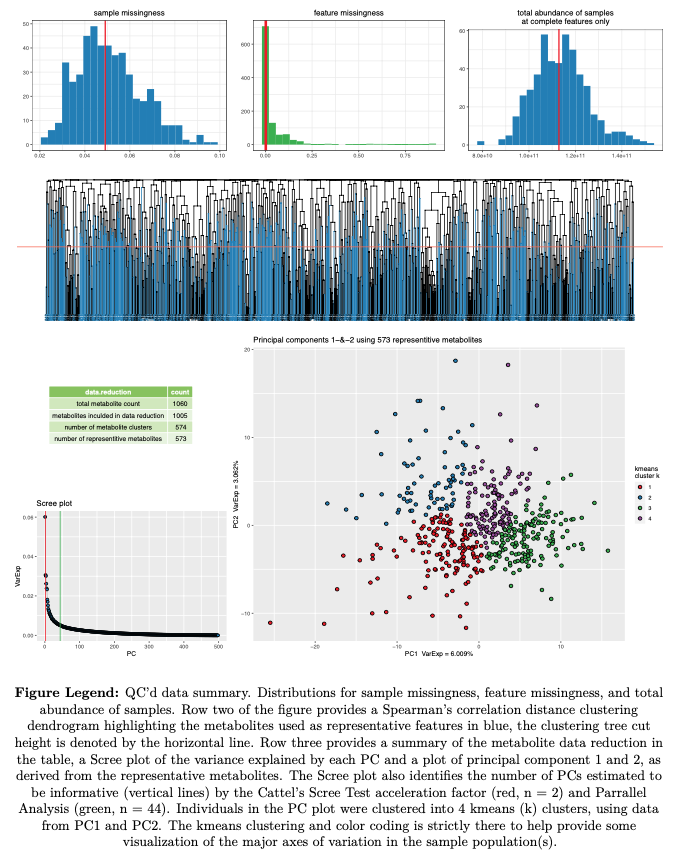
- Summary of data filtered data
- sample size
- summary figures
- missingness distributions
- feature dendrogram
- PCA
- distribtion of Shapiro W-statistics
- outlier summary
- Batch effects
- feature missingness
- as influenced by:
- feature SUPER_PATHWAY (categorical function)
- MS method
- LC/MS Polar, Pos Late, Pos Early, Neg
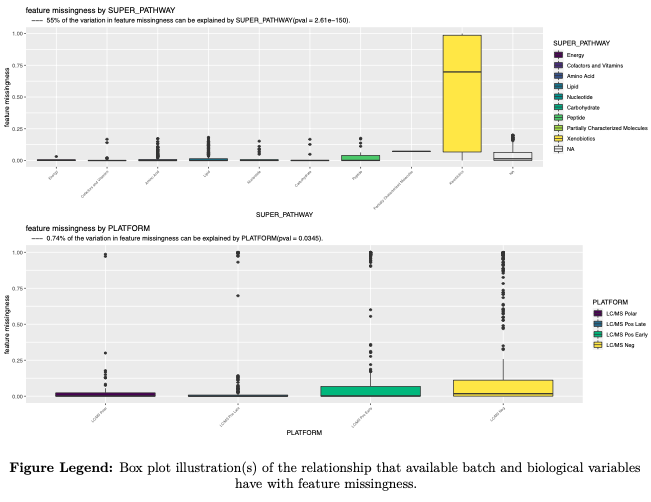
- LC/MS Polar, Pos Late, Pos Early, Neg
- as influenced by:
- sample missingness
- as influenced by:
- BOX_ID, storage box
- RUN_DAY, day the samples were processed on tech
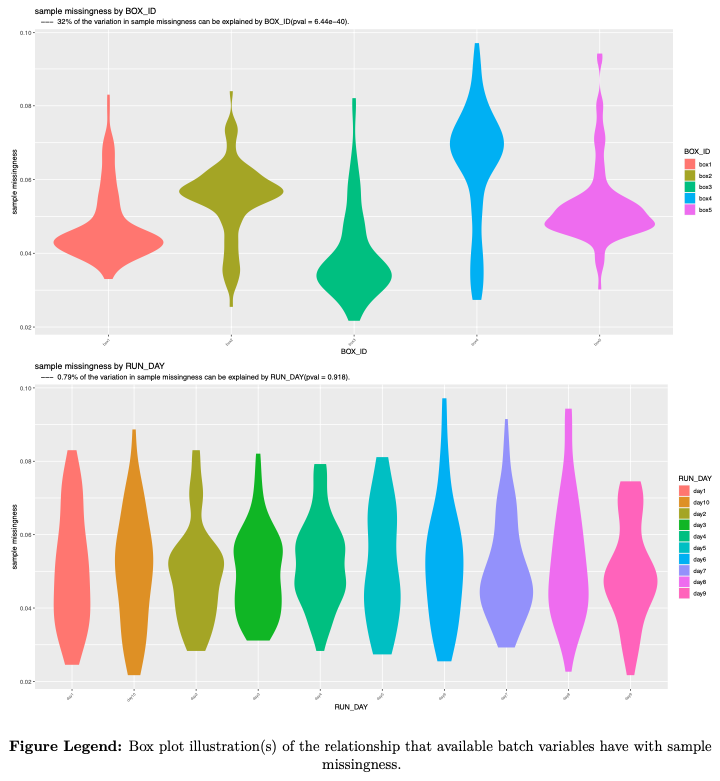
- multivariate analysis of both BOX_ID and RUN_DAY on missingness
- as influenced by:
- sample total peak|abundance area
- as influenced by:
- BOX_ID, storage box
- RUN_DAY, day the samples were processed on tech
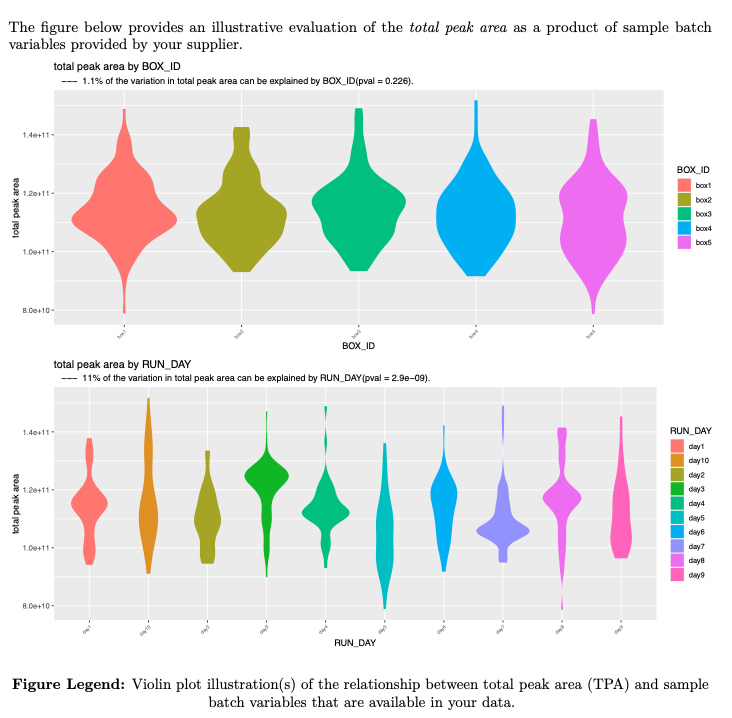
- multivariate analysis of both BOX_ID and RUN_DAY on missingness
- as influenced by:
- feature missingness
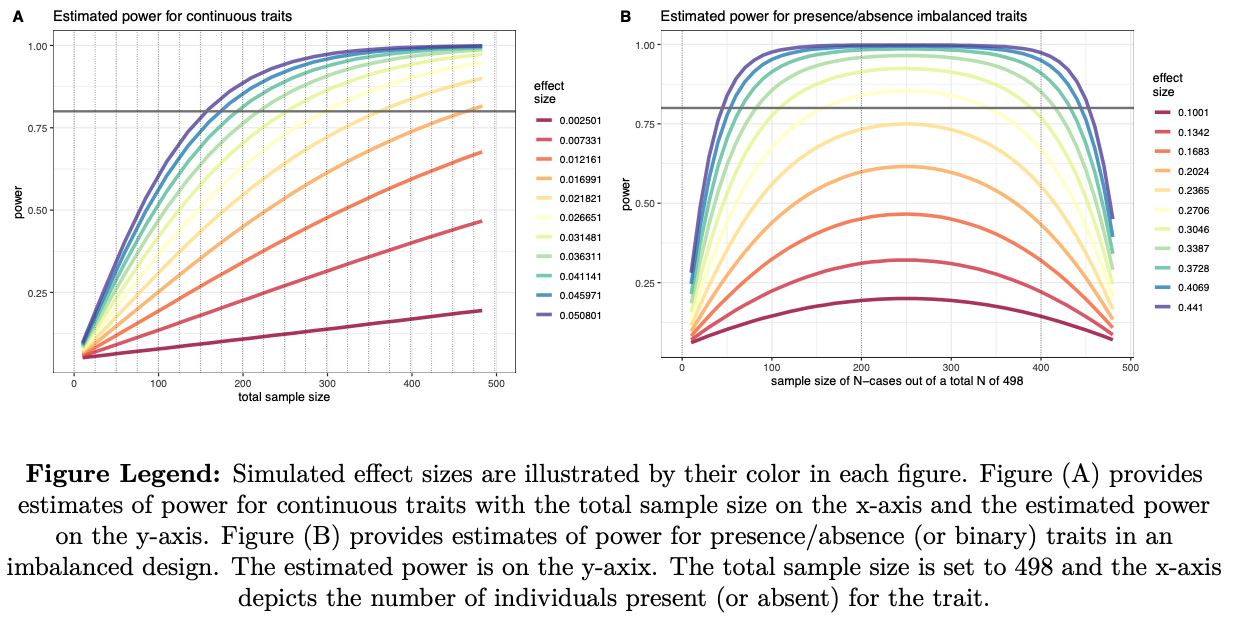
- Power Analysis
- presence -vs- absence
- continuous


- 2022, Feb 7th: Edited the run_metaboprep_pipeline.R script to run the Metabolon normalization only when parameter 6 is Metabolon, rather than not Nightingale. (line 430 in script).