Vacation-Weather-Dashboard
Dashboard
Click here to view the live Dashboard!
Purpose
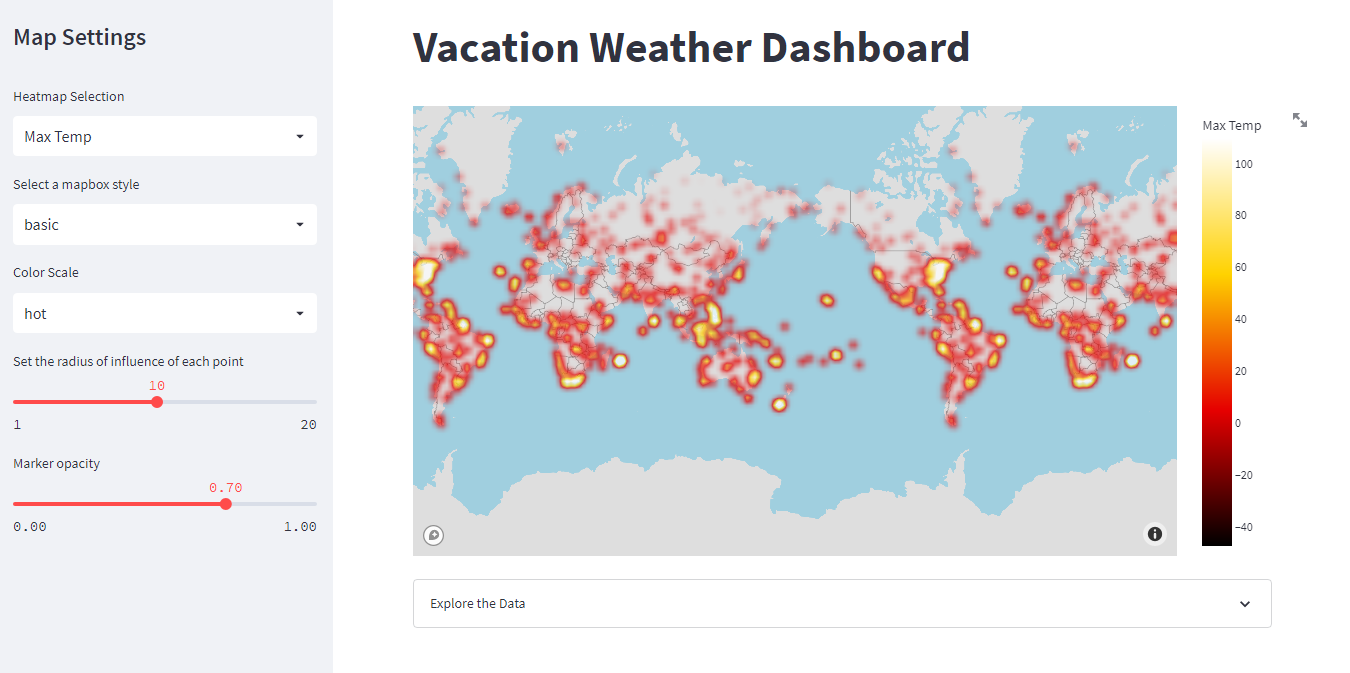
This project constructs an interactive dashboard to implement data visualizations for varying weather conditions (temperature, humidity, wind speed, and cloudiness).
The dataset comes from World Weather Analysis. The weather data is archived from December 2, 2021. The original data was obtained from OpenWeatherMap API, and the city locations were obtained from the MaxMind World Cities Database using the CitiPy library. View the original World Weather Analysis repository for more information on how the data was collected and parsed.
- Data visualizations that are attractive, accessible, and interactive
- Interactive features such as dropdowns, sliders, and hover data
- Deploy an interactive dashboard with Streamlit
Resources
- Data Source:
cities.csv - Libraries:
Pandas,Plotly,Streamlit,StatsModels - Additional: Mapbox, OpenWeatherMap
- Source Code:
streamlit_app.py