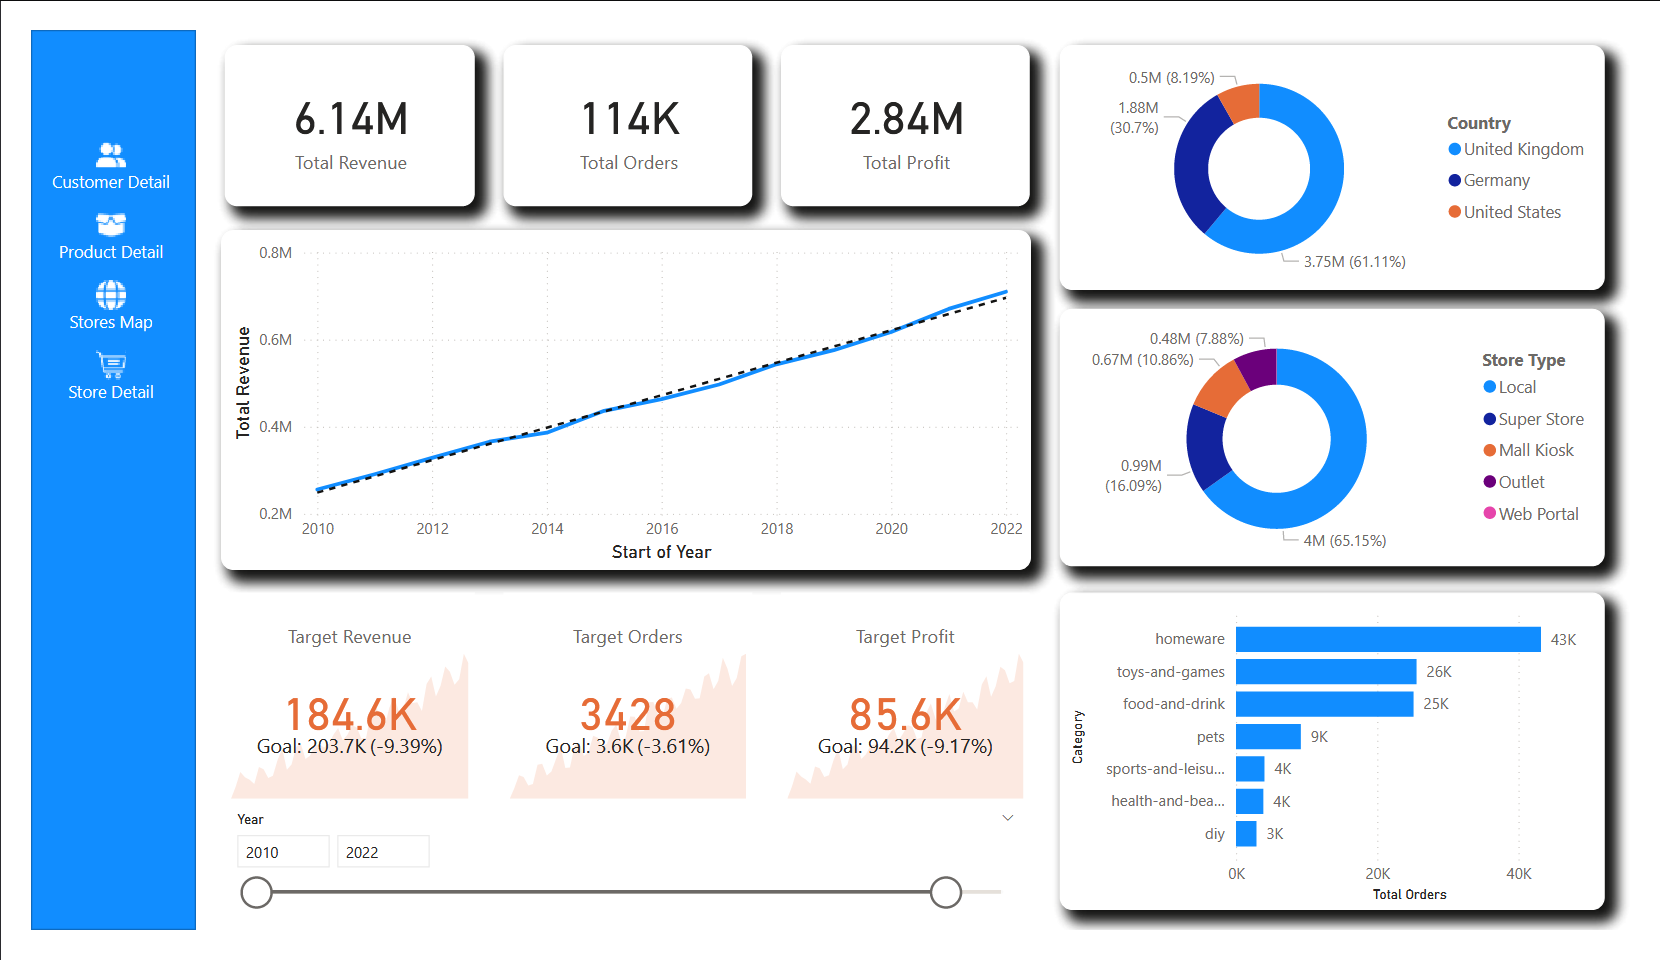
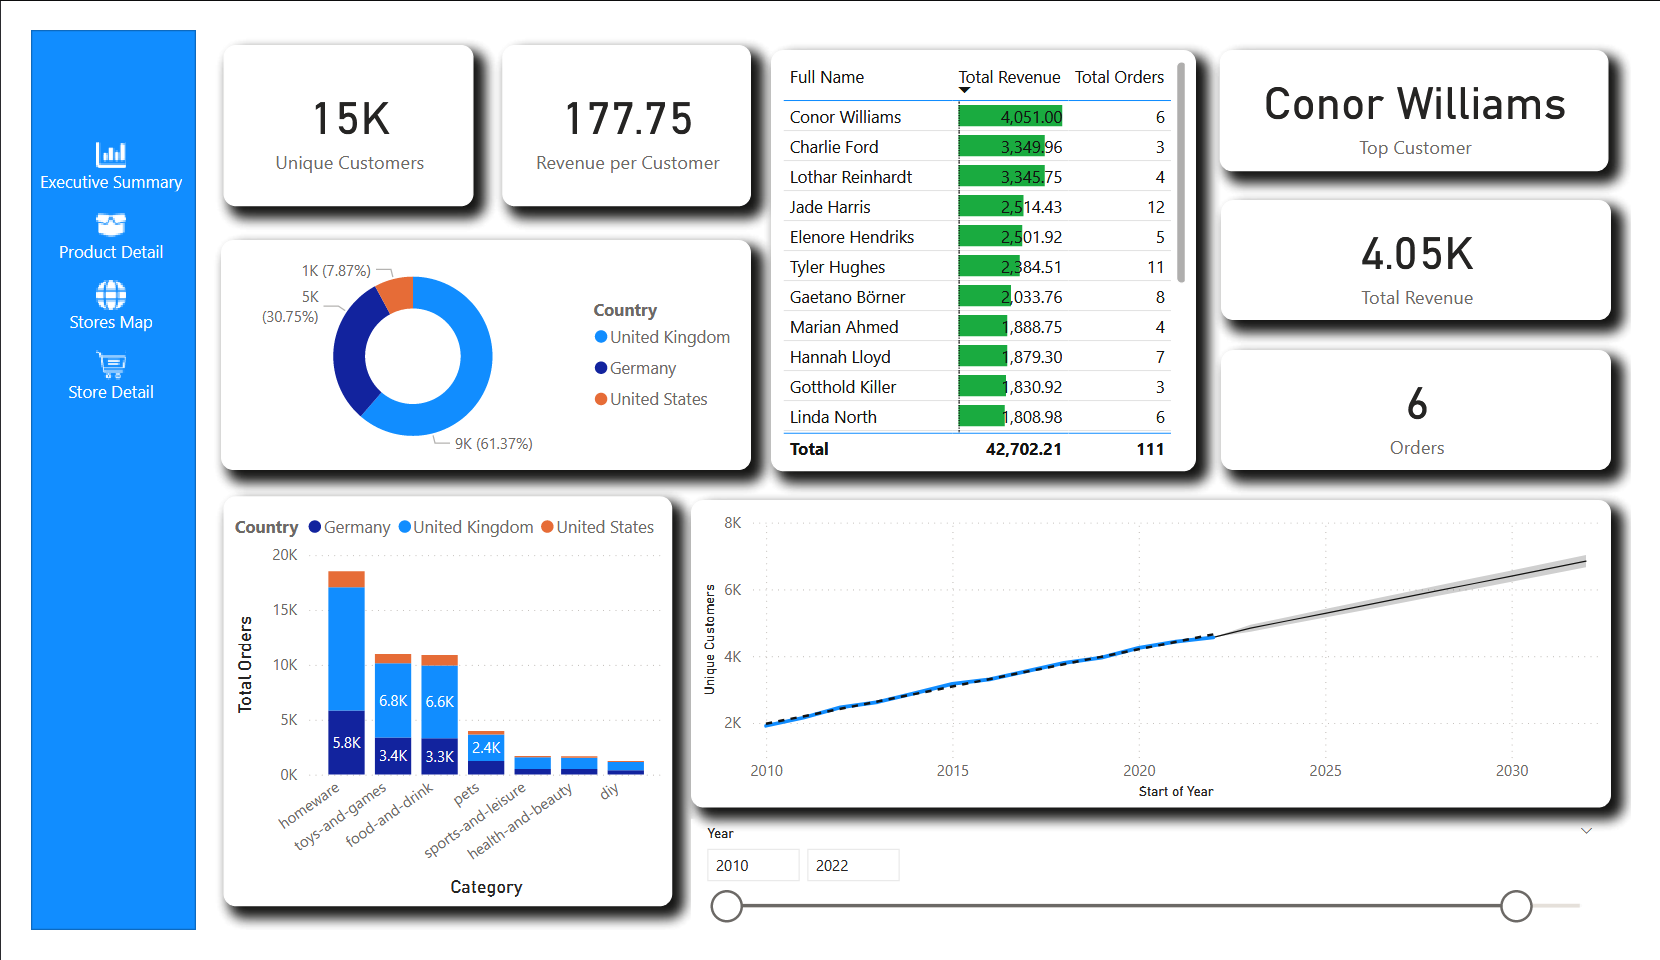
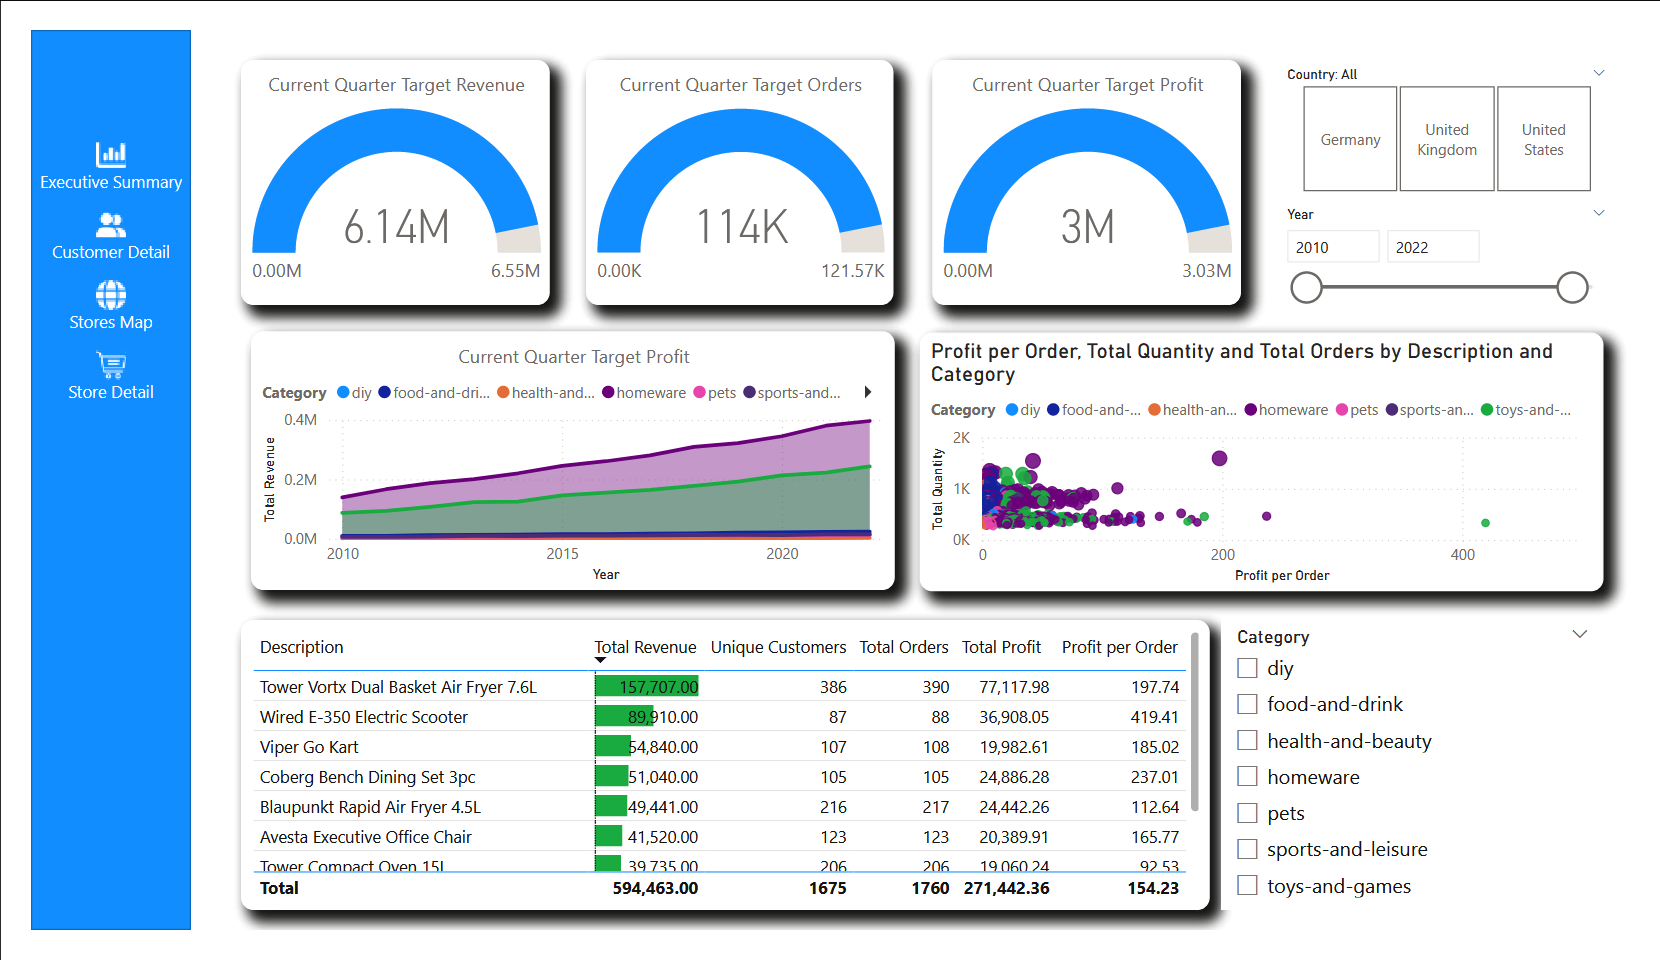
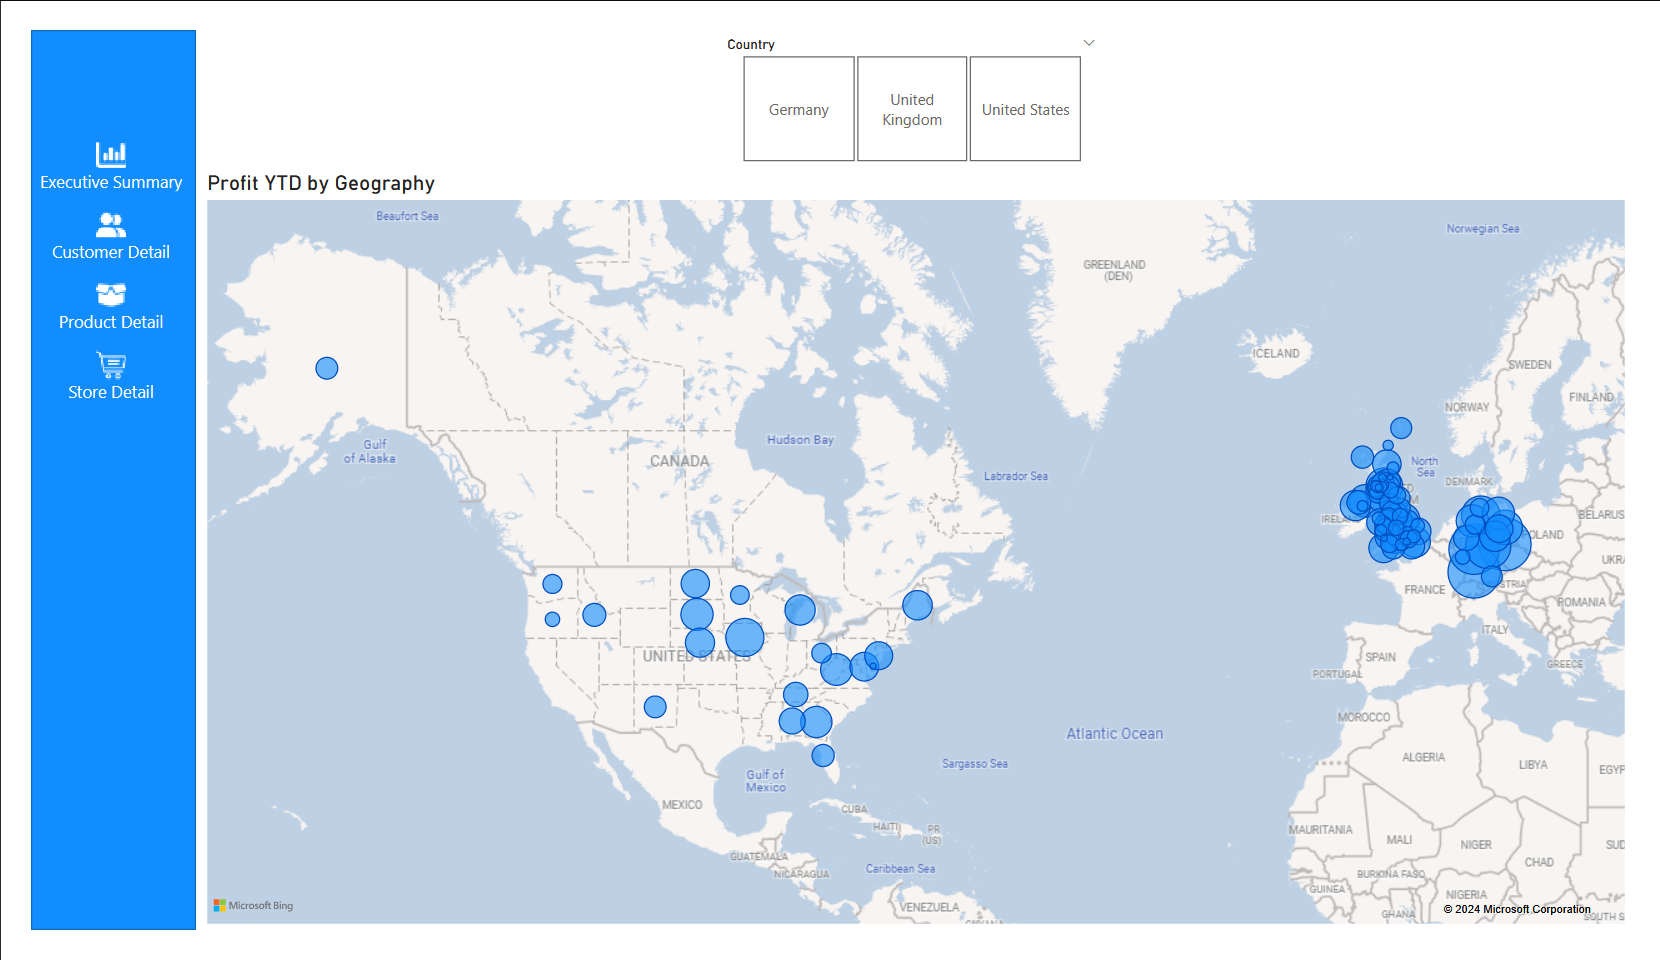
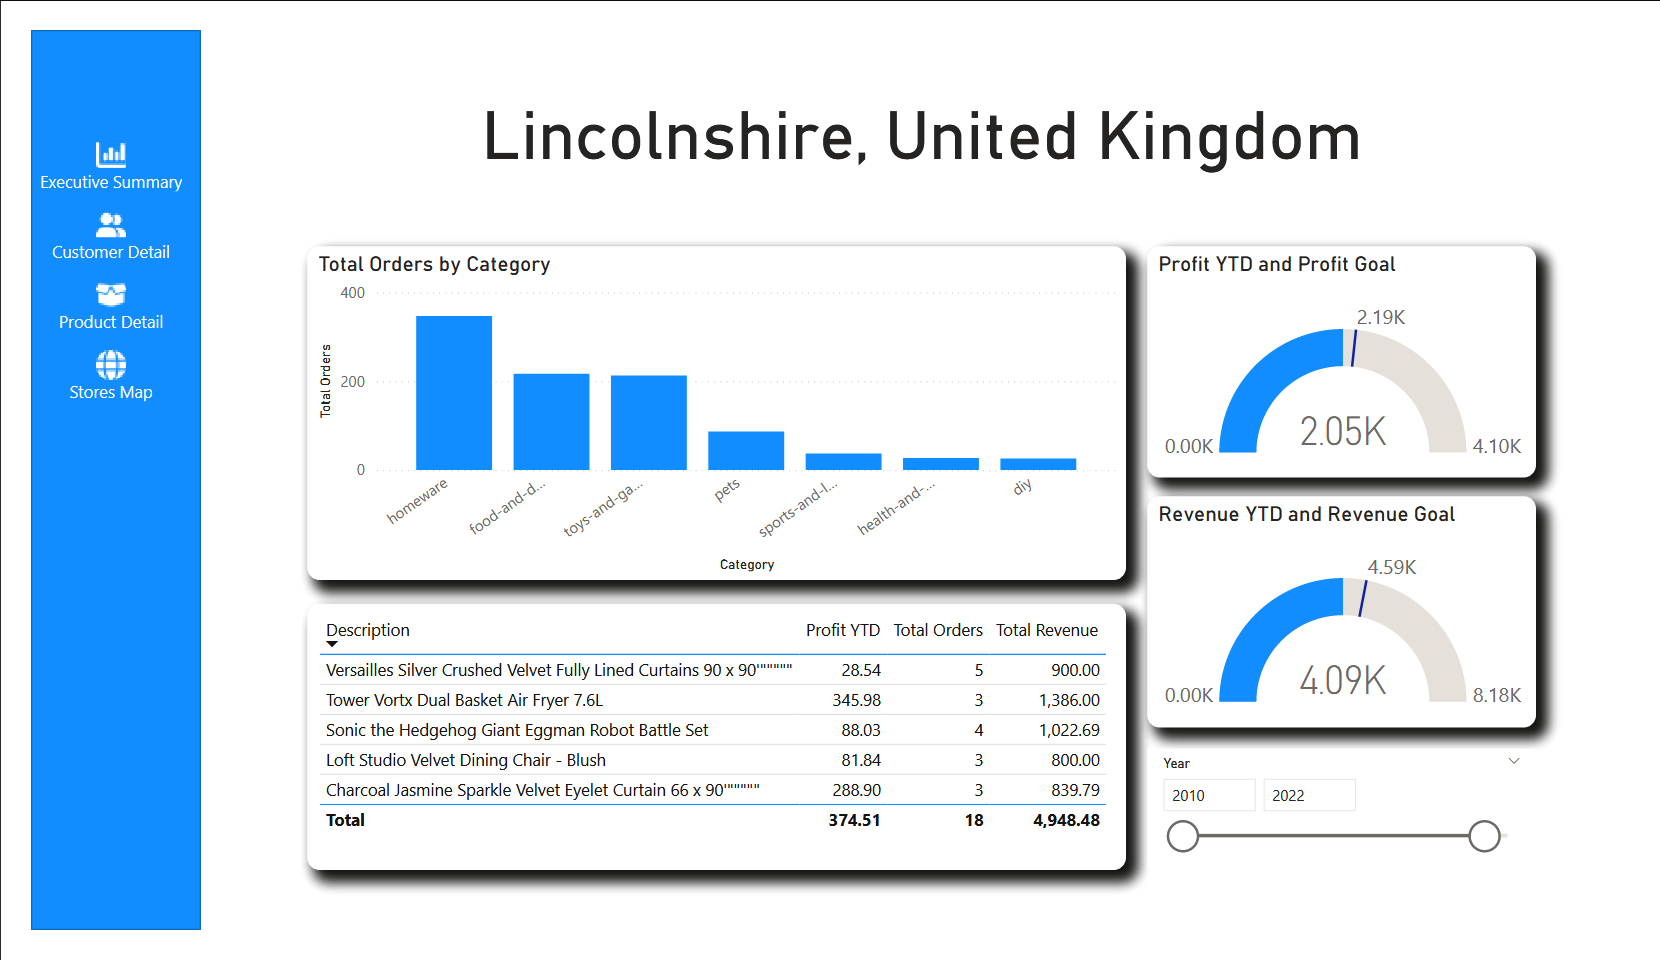
This repository contains the files and documentation for my Power BI Data Analysis project, showcasing my skills in data visualization and analysis. The project focuses on transforming data into actionable insights for better decision-making by using Microsoft Power BI to design a comprehensive Quarterly report.
This project involves:
- Extracting and transforming data from various origins
- Designing a robust data model rooted in a star-based schema
- Constructing a multi-page report
The report presents:
- A high-level business summary tailored for C-suite executives
- Insights into the company's highest value customers segmented by sales region
- A detailed analysis of top-performing products categorised by type against their sales targets
- A visually appealing map visual that spotlights the performance metrics of their retail outlets across different territories
├── Q&A/
│   ├── questions.txt
|   ├── question_1.sql
|   ├── question_1.csv
|   └── question_2.sql ...
├── navigation_bar_images/
│   ├── UI Icon #1.png
│   ├── UI Icon #1 Hover.png
|   └── UI Icon #2.png ...
├── Power BI Project.pbix
├── LICENSE.txt
└── README.md
SELECT SUM(staff_numbers)
FROM dim_store
WHERE country = 'UK';
13273
SELECT d.month_name
FROM dim_date AS d
JOIN orders AS o ON d.date = o.order_date
JOIN dim_product AS p ON o.product_code = p.product_code
WHERE d.year = 2022
GROUP BY d.month_name
ORDER BY SUM(p.sale_price * o.product_quantity) DESC
LIMIT 1;
August
SELECT s.store_type
FROM dim_store AS s
JOIN orders AS o ON s.store_code = o.store_code
JOIN dim_date AS d ON o.order_date = d.date
JOIN dim_product AS p ON o.product_code = p.product_code
WHERE d.year = 2022 AND
    s.country = 'Germany'
GROUP BY s.store_type
ORDER BY SUM(p.sale_price * o.product_quantity) DESC
LIMIT 1;
Local
Q4. Create a view where the rows are the store types and the columns are the total revenue, percentage of total revenue and the count of orders
CREATE VIEW summary AS
    SELECT s.store_type,
        ROUND(CAST(SUM(p.sale_price * o.product_quantity) AS NUMERIC), 2) AS total_revenue,
        ROUND(CAST(SUM(p.sale_price * o.product_quantity) / SUM(SUM(p.sale_price * o.product_quantity)) OVER() * 100 AS NUMERIC), 2) AS percentage_of_revenue,
        COUNT(o) AS order_count
    FROM dim_store AS s
    JOIN orders AS o ON s.store_code = o.store_code
    JOIN dim_product AS p ON o.product_code = p.product_code
    GROUP BY s.store_type;
| store_type | total_revenue | percentage_of_revenue | order_count |
|---|---|---|---|
| Local | 4200344.27 | 65.02 | 78409 |
| Mall Kiosk | 705645.90 | 10.92 | 13142 |
| Outlet | 508029.41 | 7.86 | 9207 |
| Super Store | 1045045.19 | 16.18 | 19276 |
| Web Portal | 1067.77 | 0.02 | 43 |
SELECT p.category
FROM dim_product AS p
JOIN orders AS o ON p.product_code = o.product_code
JOIN dim_store AS s ON o.store_code = s.store_code
JOIN dim_date AS d ON o.order_date = d.date
WHERE s.full_region = 'Wiltshire, UK' AND
    d.year = 2021
GROUP BY p.category
ORDER BY SUM((p.sale_price - p.cost_price) * o.product_quantity) DESC
LIMIT 1;
Homeware
