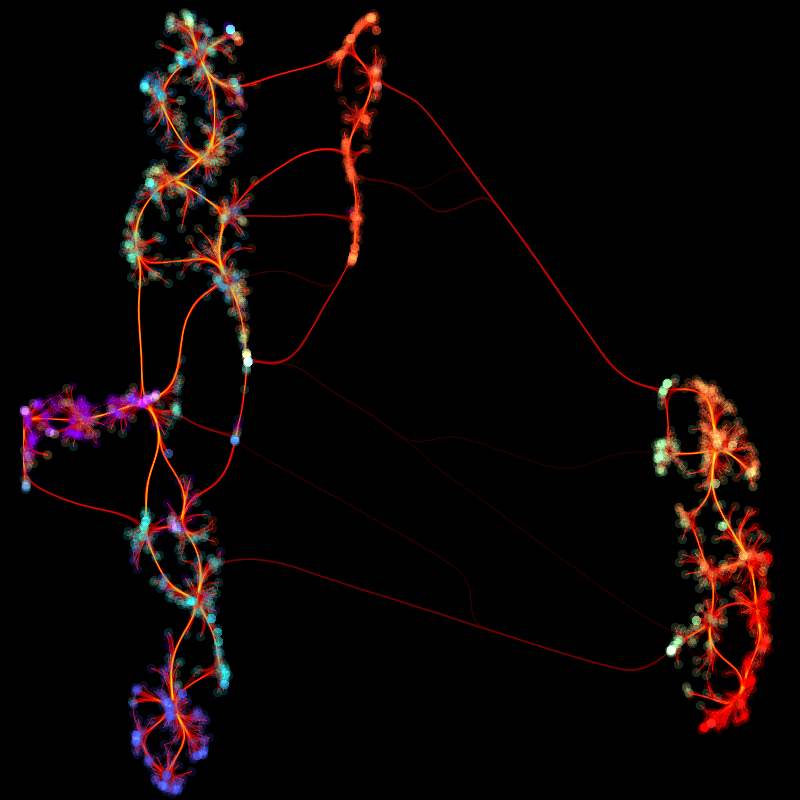
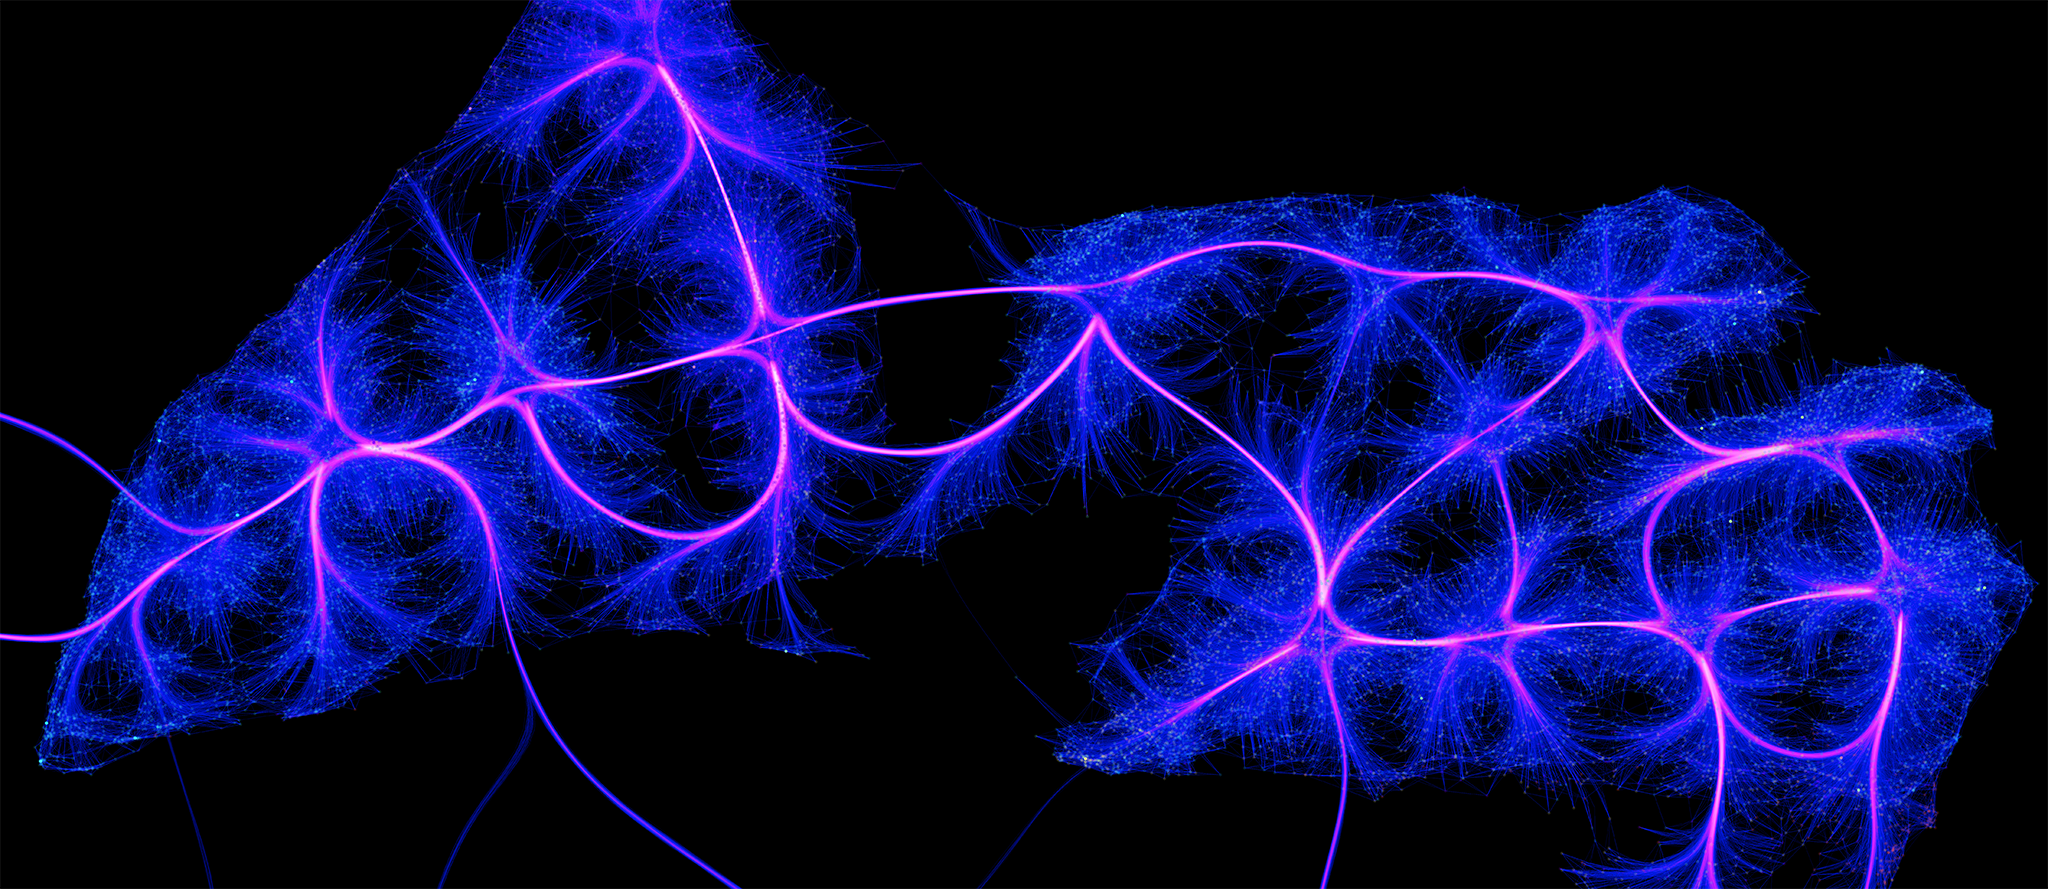
This repository shows how to make pictures like the one above.
This simple repo contains code for training a VAE on fashion MNIST data and
then using the encoder from the VAE to generate features for each fashion
MNIST image. These are then used as the inputs for the UMAP projection.
The latter relies heavily on the excellent umap-learn
python library.
Set up the environment
Clone this repository somewhere:
git clone https://github.com/dhudsmith/nnet_umap.gitWith anaconda installed, navigate to the project root and execute
conda env create -f environment.ymlTo start the environment, execute
conda activate nnet_umapUse conda deactivate to exit.
Starting jupyter
Within the conda environment, execute
jupyter labJupyter should open in your default browser. If not, follow the link in your terminal.
Training the VAE
You can optionally run through train_vae.ipynb jupyter notebook to train the VAE yourself
using the fashion-MNIST dataset. A pretrained encoder
is available in the models/ folder, so you can skip this unless you want to
customize the model or use a different dataset.
Generating the graphic
Run through umap_projection.ipynb to generate the visual. Note the settings at the top
these control the number of data points used, the color scheme,
the resolution, and the size of data points. The code can take an hour or more
run if you use lots of data points. The default parameters should run in a few minutes
on most machines. If all goes well, you should get something like this with default settings:

