Project Atlas - São Paulo is a Data Science and Engineering initiative that aims at developing relevant and curated Geospatial features about the city of São Paulo, Brazil. It's ultimate use is varied, but it is mainly focused on Machine Learning tasks, such as Real State price prediction.
It aggregates several attributes from many public data sources at different levels of interest, which can be used to match geospatially referenced data (lat,long pairs for example).
A breakdown of the data sources currently used and their original references can be found below, but the official documentation of the project contains the full list of data sources.
- GeoSampa: geospatial data exploration tool provided by the São Paulo's Department of Urban Development;
- IBGE: raw datasets from the 2010 Census conducted by the Brazilian Institute of Geography and Statistics;
- Infocidade: multiple sources from the city of São Paulo's local government entities;
- São Paulo Open Data Portal: multiple curated data sources from the city of São Paulo;
The main technologies used in this project were:
- Data processing:
Apache Spark,pyspark; - Geospatial data wrangling:
Apache Sedona,geopandas,fiona; - Data Versioning:
dvc
The project is broken down by different levels of granularities of Geospatial references. These are:
- Census Sectors: the lowest level of census information, that can be roughly approximated to a street block;
- Zip code different from a block, the zip code can be roughly approximated to a streets;
- Area of Ponderation: areas of ponderation are aggregations of census sectors, which vary in size. The level of interest is important as some of the data sources in the project are only described in such level;
- Neighborhoods: neighborhoods are not formally defined and place in between
districtsandareas of ponderationwhen it comes to size; - Districts: districts are administrative regions in the city of São Paulo, which is defined formally by law (with that, their boundaries do not change that much over time);
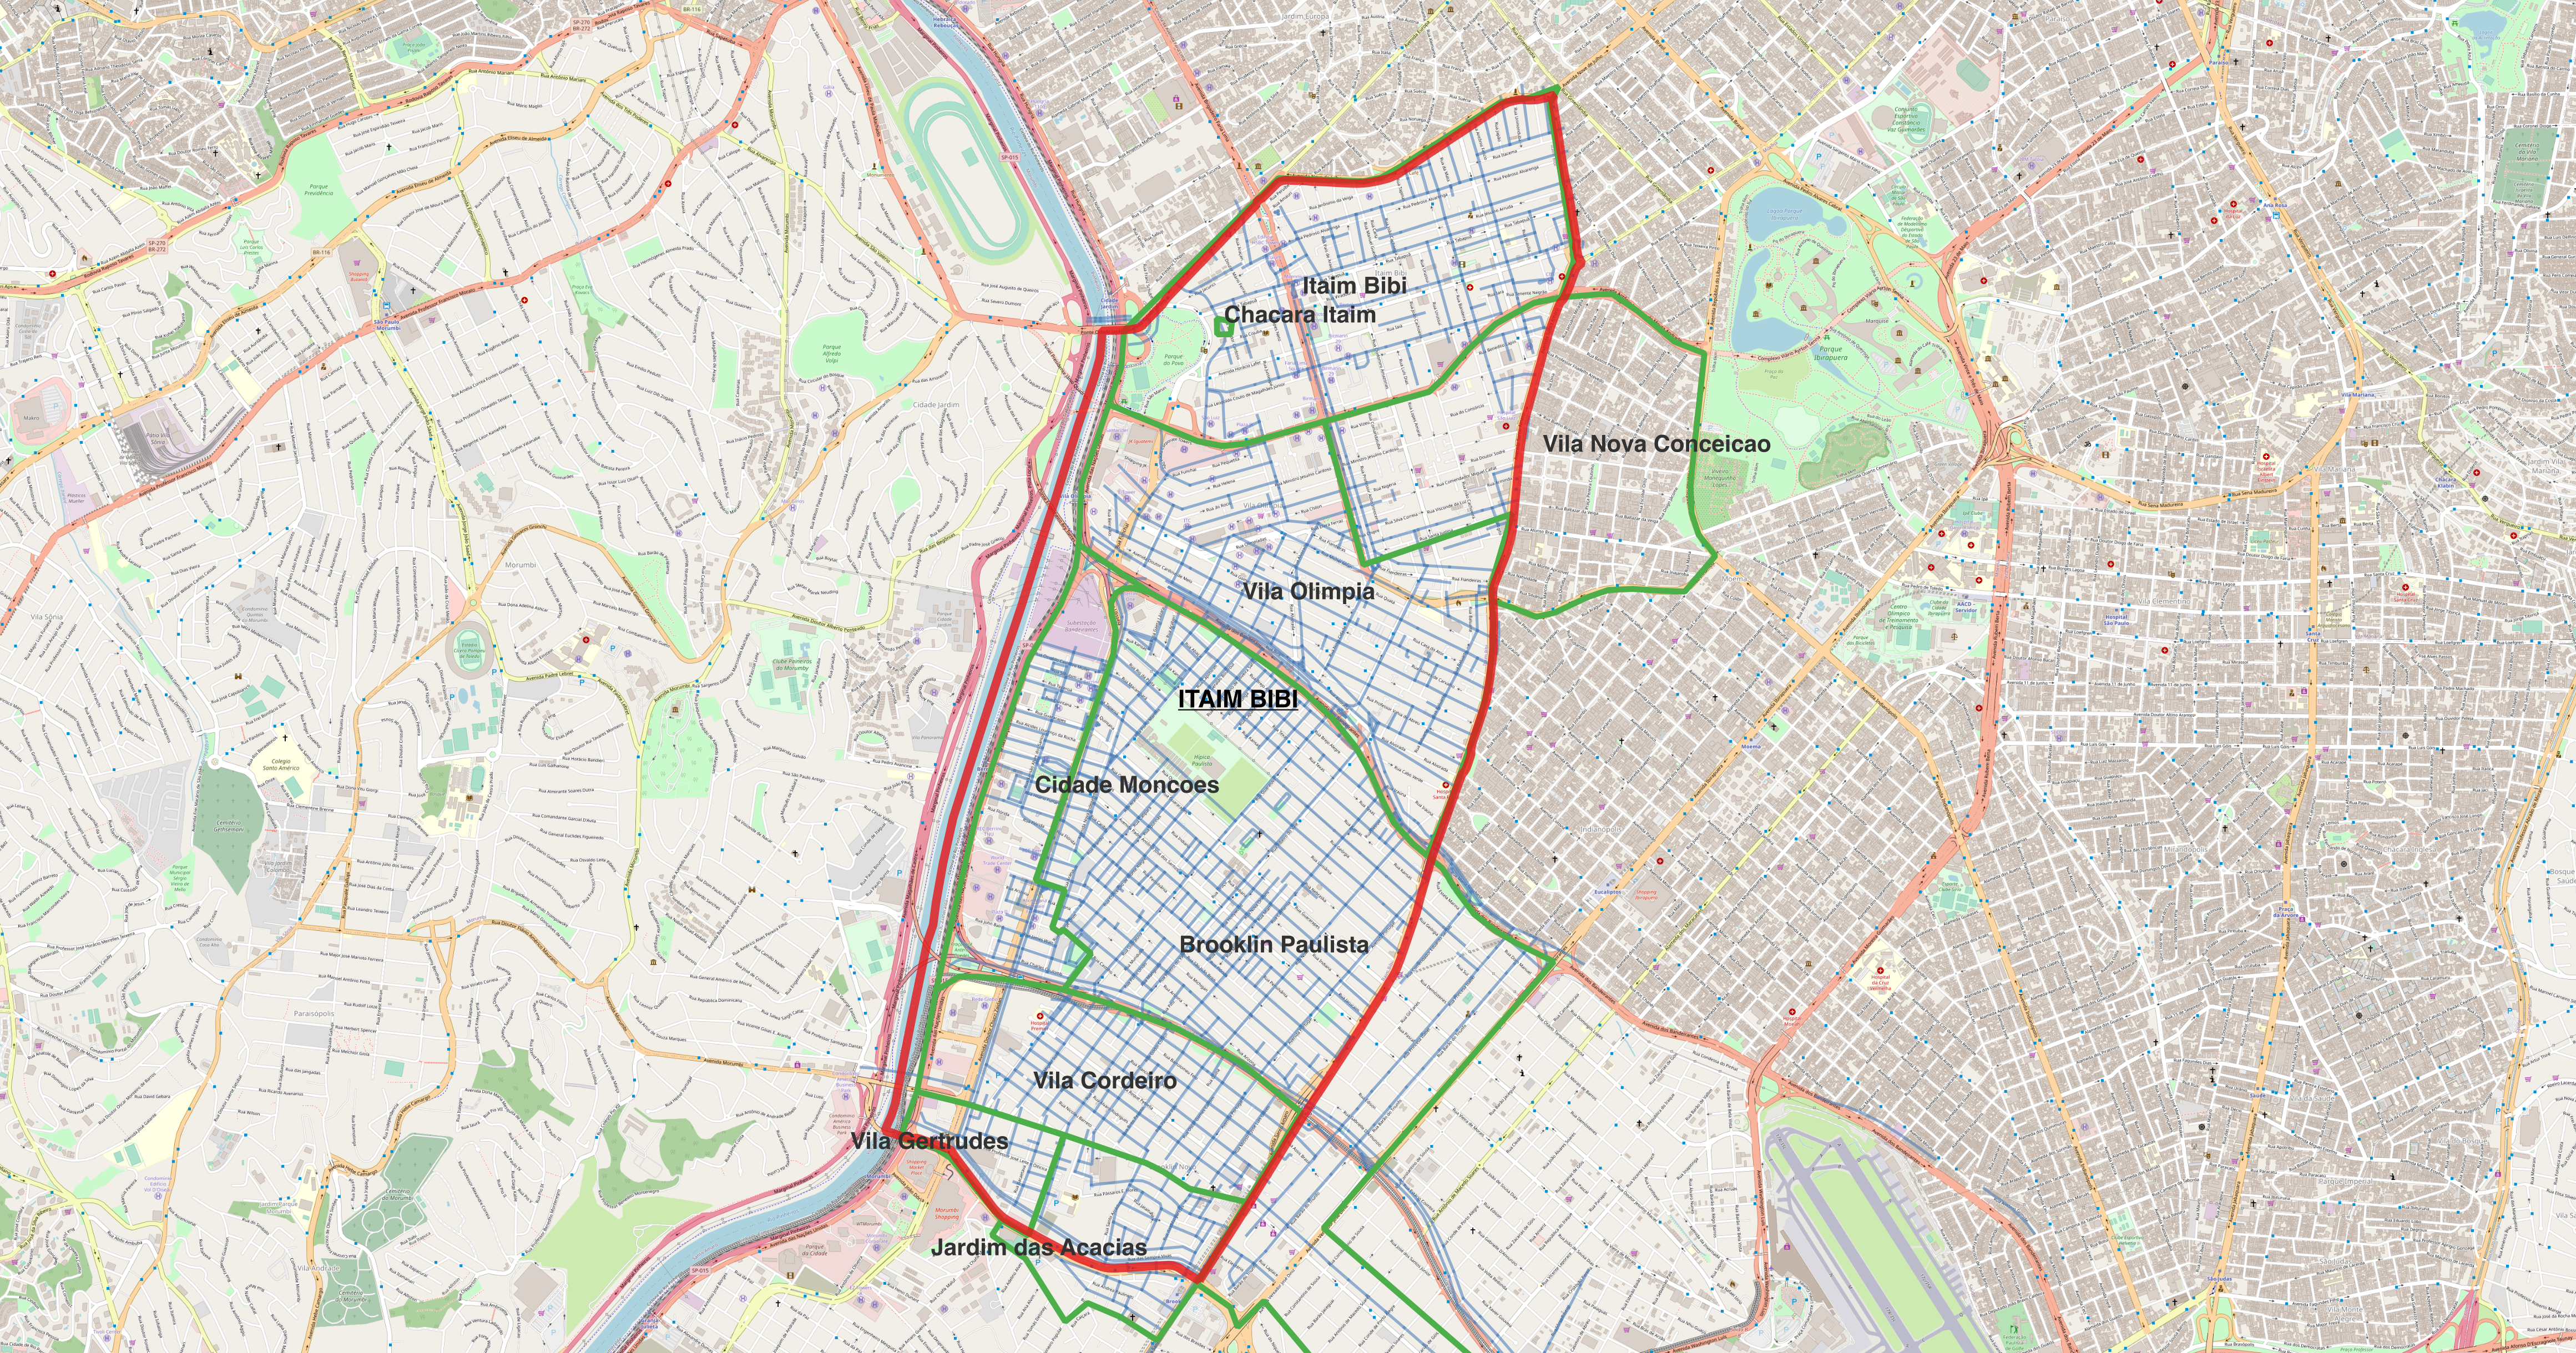
The map below iilustrates this relationship:
Note: The outer red line indicates the
districts. The green line represents theneighborhoods. The blue lines indicatezipcodes, as so on.
