Add toggle functionality to the legend entries of a plot: switch individual data sets on or off.
The usage of this little function is easy. After having created a plot as usual, e.g.
% clear the workspace
clear, close all, clc

% generate a random matrix
mat_data = rand(30, 3);

% plot the data
figure(1);
plot(mat_data);
xlabel('day of month');
... and adding a legend
% create a standard legend
% (and obtain the handle)
legend({'number of shoes', ...
        'enemies confused', ...
        'raindrops falling on my head'});
the legend entries can be transformed into toggle switches as easy as this:
% now change the legend to be clickable
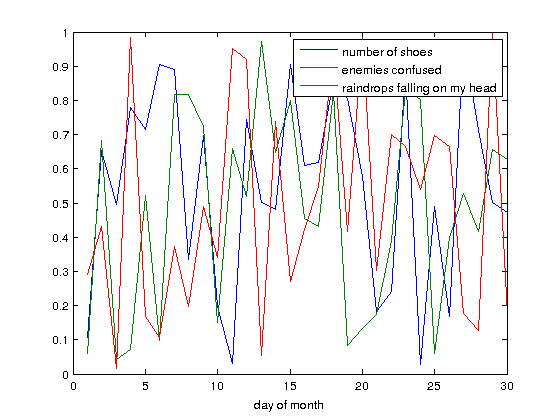
legend_curve_selector(legend);With all entries switched on the legend looks as always:

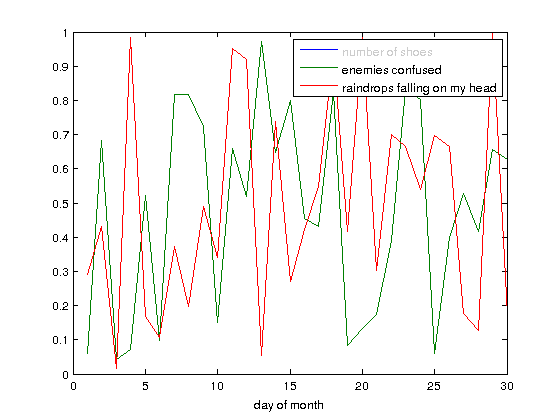
Toggling a legend entry by clicking on it switches off the associated data set and changes the color of the legend text to gray:
