This repo contains code to perform analyses described in our paper, "An Automatic Finite-Sample Robustness Metric: When Can Dropping a Little Data Make a Big Difference?" for the case of ordinary least squares and instrumental variable regressions. The repo name comes from "Z-estimator approximate maximal influence".
Breaking update warning:
The move from tag v0.2 to v0.3 made big changes to the API and
code organization, and is not backwards compatible. The change fixed
an major bug
and generally made the code generally less research-y. See
examples/simple_examples.R for a guide to the new API.
To use the old version instead of the new,
install as below using the argument ref="v0.2" instead of ref=master.
Note that paired
removal, a feature in the previous version, is not yet supported in the new
version. For a complete descrition of the new API, see
zaminfluence/R/README.md. Please report any problems or questions by
opening an issue on Github or emailing me.
- You can install the R library directly from github.
> library(devtools)
> devtools::install_github("https://github.com/rgiordan/zaminfluence/",
                           ref="master",
                           subdir="zaminfluence",
                           force=TRUE)
You can install different branches using the ref argument.
- Done, hopefully! You should now be able to run the script in
examples/simple_examples.R.
Please submit an issue or email us if you have any questions or comments!
The following simple example finds and plots influential
sets for a linear regression problem. It is taken from
examples/simple_examples.R.
library(tidyverse)
library(gridExtra)
library(zaminfluence)

#############################
# Generate data.
set.seed(42)
num_obs <- 1000
x_dim <- 3
param_true <- 0.1 * runif(x_dim)
df <- GenerateRegressionData(num_obs, param_true, num_groups=NULL)

#############################
# Fit a regression model.
x_names <- sprintf("x%d", 1:x_dim)
reg_form <- formula(sprintf("y ~ %s - 1", paste(x_names, collapse=" + ")))
fit_object <- lm(data = df, formula=reg_form, x=TRUE, y=TRUE)

#############################
# Now it's zaminfluence time!

# Get influence scores for the first two regressors.
model_grads <-
    ComputeModelInfluence(fit_object) %>%
    AppendTargetRegressorInfluence("x1") %>%
    AppendTargetRegressorInfluence("x2")

# Compute the changes needed to change sign, significance, and both
signals <- GetInferenceSignals(model_grads)

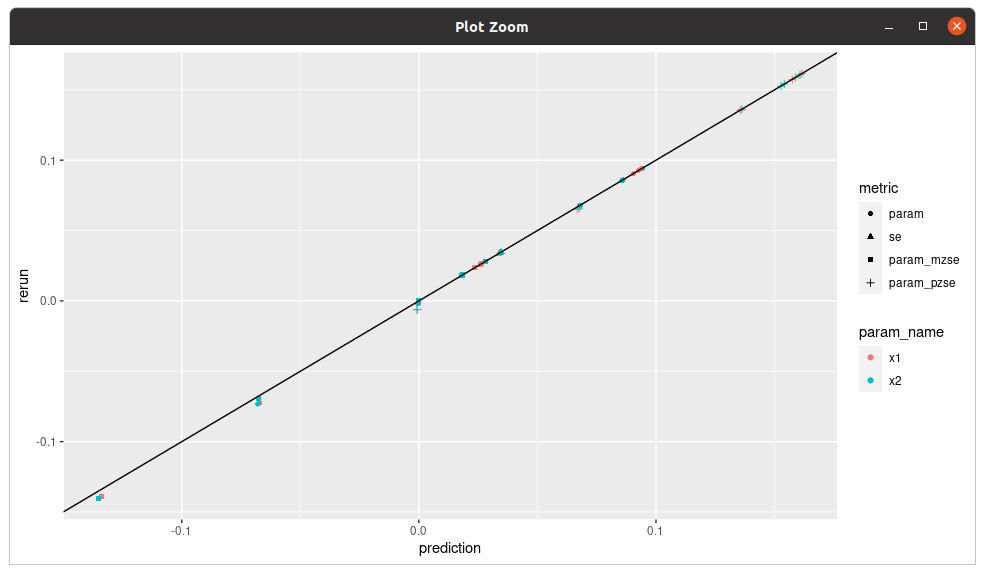
# Predict the changes, re-run the model at the left-out points, and
# compare the two.

preds <- PredictForSignals(signals, model_grads)
reruns <- RerunForSignals(signals, model_grads)
reruns_df <- GetSignalsAndRerunsDataframe(signals, reruns, model_grads)
preds_df <- GetSignalsAndRerunsDataframe(signals, preds, model_grads)

summary_df <-
    rbind(reruns_df %>% mutate(method="rerun"),
          preds_df %>% mutate(method="prediction")) %>%
    pivot_wider(names_from=method, values_from=value)

ggplot(summary_df) +
    geom_point(aes(x=prediction, y=rerun, color=param_name, shape=metric)) +
    geom_abline(aes(slope=1, intercept=0))

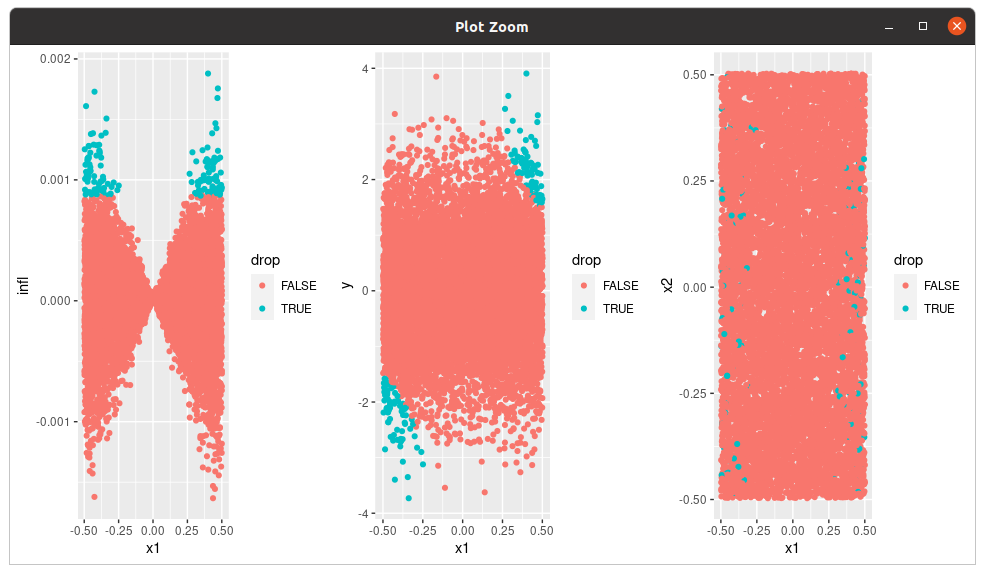
##############################################################
# Visualize which points are being dropped to change both
# sign and significance of the x1 regressor

signal <- signals[["x1"]][["both"]]
df$drop <- GetWeightVector(signal$apip$inds, nrow(df), bool=TRUE, invert=TRUE)
df$infl <- signal$qoi$infl

grid.arrange(
    ggplot(df) +
        geom_point(aes(x=x1, y=infl, color=drop)),
    ggplot(df) +
        geom_point(aes(x=x1, y=y, color=drop)),
    ggplot(df) +
        geom_point(aes(x=x1, y=x2, color=drop)),
    ncol=3
)

