ColumbiaX CSMM.102x Machine Learning Course. Week 8 Assignment on clustering. In this project we implement unsupervised machine learning models via the K-means and EM Gaussian mixture models.
Note this work is also available on Kaggle at: https://www.kaggle.com/mariamingallon/ai-columbiax-ml-w8-kmeans-emgmm-clustering
In this assignment, we will implement the K-means and EM Gaussian mixture models. Assume the following:
- We are given n data points {x1,…,xn}, where each xi∈Rd.
- With K-means we are trying to find K centroids {μ1,…,μK} and the corresponding assignments of each data point {c1,…,cn}, where each ci ∈ {1,…,K} and ci indicates which of the K clusters the observation xi belongs to. The objective function that we seek to minimize can be written:
- We will use the Expectation-Maximisation (EM) algorithm to learn the parameters of a Gaussian mixture model (GMM), that is learning π, μ and Σ. For this model, we assume a generative process for the data as follows:
- In the above equation, the ith observation is first assigned to one of K clusters according to the probabilities in vector π, and the value of observation xi is then generated from one of K multivariate Gaussian distributions, using the mean (μ) and covariance indexed by ci.
- Finally, implement the EM algorithm to maximize, the equation below over all parameters π,μ1,…,μK,Σ1,…,ΣK using the cluster assignments c1,…,cn as the hidden data:
- Note that the K-means and EG-GM algorithms shall be written to learn 5 clusters. Run both algorithms for 10 iterations.
- The algorithms can be initialized arbitrarily. It is recommended that the K-means centroids are initialized by randomly selecting 5 data points (K-memoids). For the EM-GMM, the mean vectors can be initialized in the same fashion, with π initialized to be the uniform distribution and each Σk to be the identity (I) matrix. Note that when initializing GMM we will first have run K-menas and we will use the resulting cluster centers as the means of the Gaussian components.
- Finally, note that GMM yields a probability distribution over the cluster assignment for each point; whereas K-means gives a single hard assignment.
More details about the inputs and the expected outputs are given below.
The following command will execute your program:
$ python3 hw3_clustering.py X.csv
Note the following:
- The name of the dataset is passed on via
X.csv. This file is a comma separated file containing the data. Each row corresponds to a single vector xi . - The main .py file shall be named
hw3_clustering.py. This file includes both the K-means and the EM-GMM algorithms.
We need to write the K-means and EM-GMM algorithms to learn 5 clusters. We need to run both algorithms for 10 iterations each. We will initialize them arbitrarily, the recommendation being initializing the K-means centroids by randomly selecting 5 data points. For the EM-GMM, it is also recommended to initialize the mean (μ) vectors in the same way, and initialize pi (π) to be the uniform distribution, and each covariance matrix per cluster (Σk) to be the identity matrix.
When executed, the code writes several output files, each as described below, where [iteration] and [cluster] shall be replaced with the iteration and cluster number.
- centroids-[iteration].csv: This is a comma separated file containing the K-means centroids for a particular iteration. The k th row should contain the k th centroid, and there should be 5 rows. There should be 10 total files. For example, "centroids-3.csv" will contain the centroids after the 3rd iteration.
- pi-[iteration].csv: This is a comma separated file containing the cluster probabilities of the EM-GMM model. The k th row should contain the k th probability, πk , and there should be 5 rows. There should be 10 total files. For example, "pi-3.csv" will contain the cluster probabilities after the 3rd iteration.
- mu-[iteration].csv: This is a comma separated file containing the means of each Gaussian of the EM-GMM model. The k th row should contain the k th mean , and there should be 5 rows. There should be 10 total files. For example, "mu-3.csv" will contain the means of each Gaussian after the 3rd iteration.
- Sigma-[cluster]-[iteration].csv: This is a comma separated file containing the covariance matrix of one Gaussian of the EM-GMM model. If the data is d -dimensional, there should be d rows with d entries in each row. There should be 50 total files. For example, "Sigma-2-3.csv" will contain the covariance matrix of the 2nd Gaussian after the 3rd iteration.
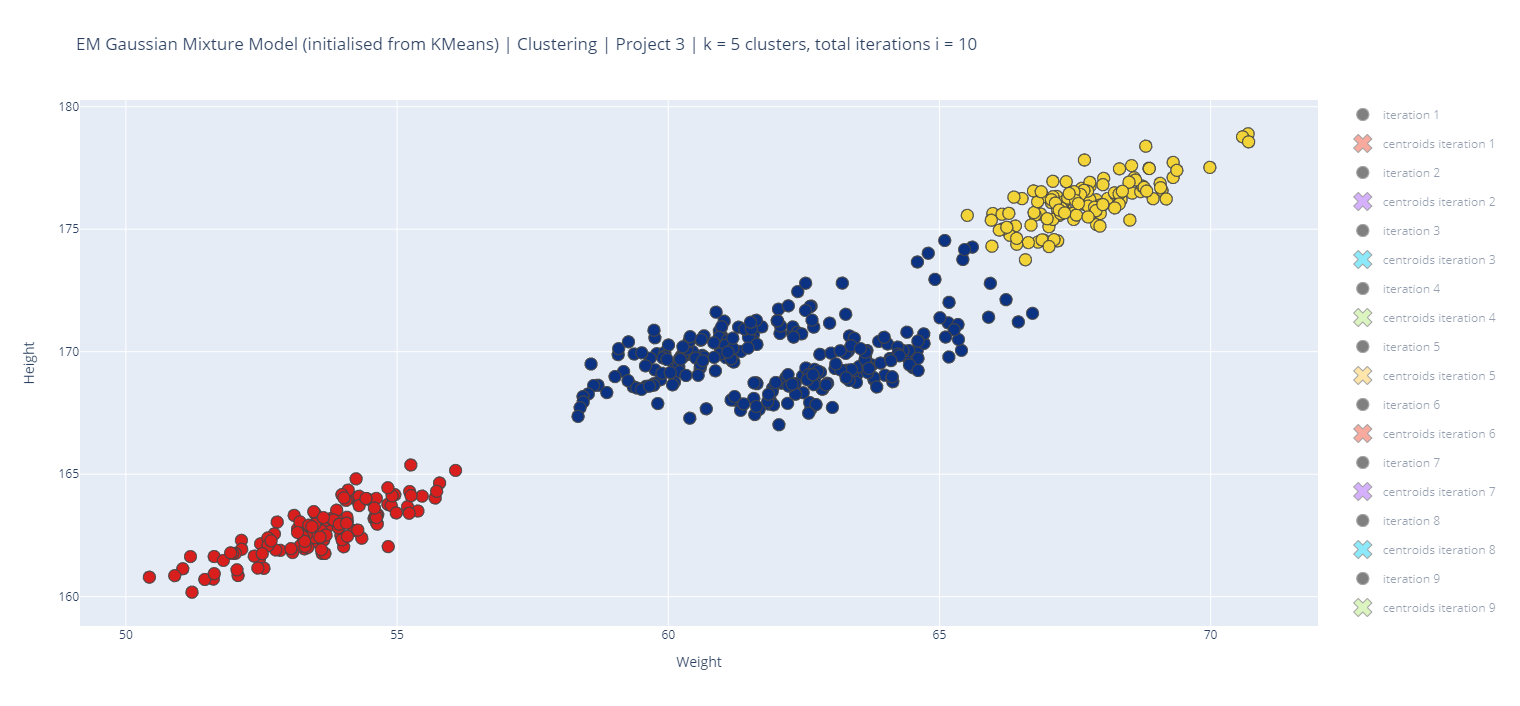
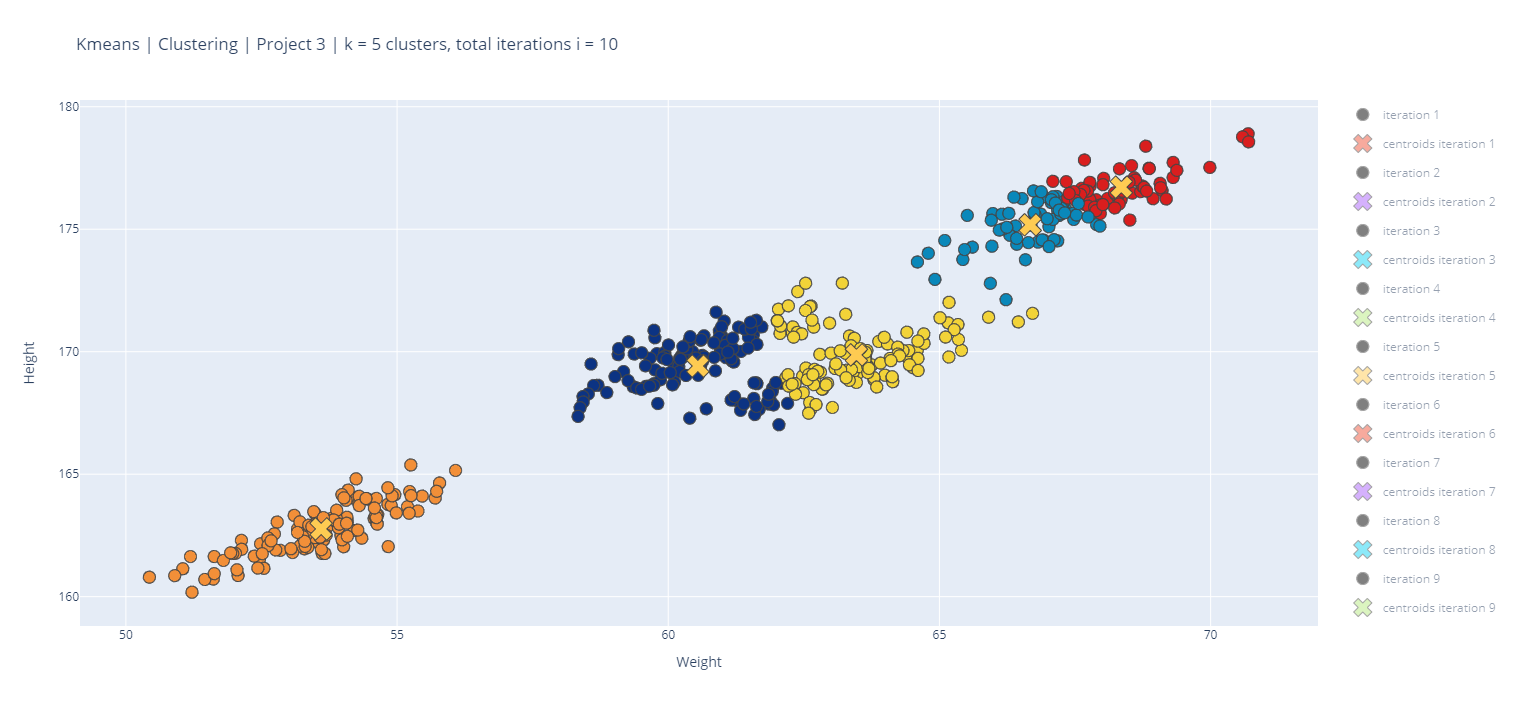
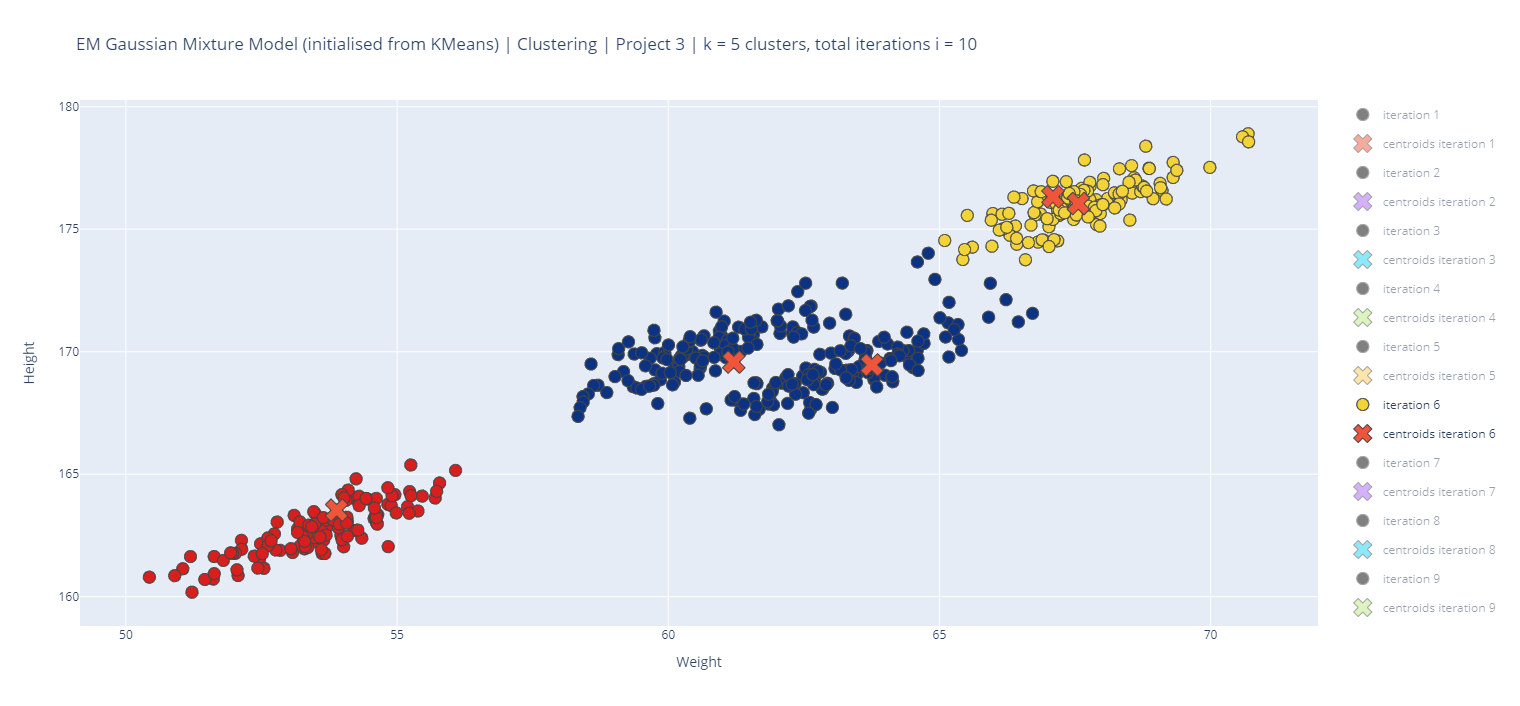
The following is a sample of some of the plots produced using 'Clustering_gmm.csv':
Please note that for both of these problems, there are multiple potential answers depending on your initialization. However, the K-means and EM-GMM algorithms have known deterministic properties that we discussed in class, and so in this sense we can distinguish between correct and incorrect answers. We strongly suggest that you test out your code on your own computer before submitting. The UCI Machine Learning Repository (http://archive.ics.uci.edu/ml/) has a good selection of datasets for clustering.
The following datasets have been selected from the UCI Machine Learning Repository for use and testing of the code written for this assignment:
- 3D Road Network (North Jutland, Denmark) Data Set This dataset was constructed by adding elevation information to a 2D road network in North Jutland, Denmark (covering a region of 185 x 135 km^2). Elevation values where extracted from a publicly available massive Laser Scan Point Cloud for Denmark (available at : [Web Link] (Bottom-most dataset)). This 3D road network was eventually used for benchmarking various fuel and CO2 estimation algorithms. This dataset can be used by any applications that require to know very accurate elevation information of a road network to perform more accurate routing for eco-routing, cyclist routes etc. For the data mining and machine learning community, this dataset can be used as 'ground-truth' validation in spatial mining techniques and satellite image processing. It has no class labels, but can be used in unsupervised learning and regression to guess some missing elevation information for some points on the road. The work was supported by the Reduction project that is funded by the European Comission as FP7-ICT-2011-7 STREP project number 288254. Refer to Citations & References.
- 3D Road Network (North Jutland, Denmark) Data Set Building Accurate 3D Spatial Networks to Enable Next Generation Intelligent Transportation Systems (Accepted and to be published in June) Proceedings of International Conference on Mobile Data Management (IEEE MDM), June 3-6 2013, Milan, Italy.
- Build Better and Accurate Clusters with Gaussian Mixture Models by Aishwarya Singh
- In Depth: Gaussian Mixture Models.
- Clustering with Gaussian Mixture Models
- K-Means Clustering in Python: A Practical Guide
- Build Better and Accurate Clusters with Gaussian Mixture Models
- Implement Expectation-Maximization Algorithm(EM) in Python from Scratch
- Gaussian Mixture Modelling (GMM)


